
Keep Calm and Drink Tea: Graphing Britain’s Most Beloved Hot Beverage

Senior Pre-Sales Consultant, Neo4j
6 min read

Here at Neo4j, we have a motto: Graphs Are Everywhere. This blog series was inspired by all the times I encountered graphs and “graph problems” in my non-working life. Hopefully these posts help you see more graphs in the world. If you’d like to share graphs you find in the wild, leave a post on the Neo4j community site, or send me a tweet (@joedepeau).
There are few things more quintessentially British than tea – it’s truly the national drink of the United Kingdom. One of the things I’ve most taken to since moving to the UK from America 12 years ago is this love of tea.
Since I firmly believe that anything worth doing is worth getting extremely geeky about, I’ve really gotten into tea. I went as far as to get a Tea Sommelier certification from the UK Tea Academy. It turns out there’s a lot to know about tea!
I’ve been thinking recently: How could all that information about tea be represented as a graph? For example, did you know that there are 61 (or 60, depending on how you count Taiwan) countries that commercially produce tea? There are even tea plantations in the UK!
MATCH (c:Country) RETURN c

For each country, there are many facts and figures you could include in a graph: details about the country itself (population and geographic coordinates, for example) and information about its tea production (total yearly volume of tea produced, number of tea estates, etc.).
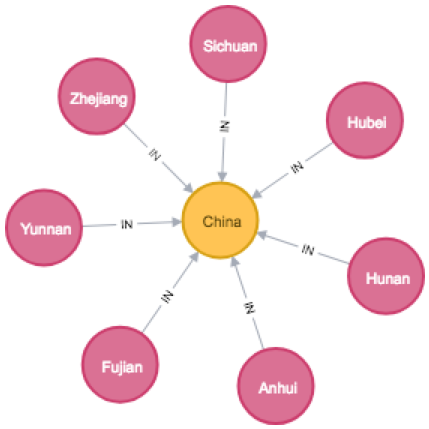
You could then further break down each country into its tea producing regions. We’ll focus on China, the world’s largest tea producer and home of some of my favorite teas, and its most notable tea producing provinces.
MATCH (p:Province)-[i:IN]->(c:Country {name: 'China'}) RETURN *
Again, for each province you could include facts about the region as well as its tea production.

You could then create new nodes to represent additional detail in your geographical hierarchy; for instance, by creating Counties or Prefectures within each Province, and then Areas, Cities or Towns within each county.
For example, we can model Anxi, a specific tea producing area which is in Quanzhou Prefecture in Fujian Province, China.
MATCH (prov:Province)-[i:IN]->(c:Country {name: 'China'})
OPTIONAL MATCH (pl:Place)-[i1:IN]->(pref:Prefecture)-[i2:IN]->(prov)
RETURN *
As an even greater level of detail you could then list individual tea Gardens or Producers within each area, but that’s probably too much information (and work) for the purposes of this post.
Next, we can add some information about tea itself into the graph.
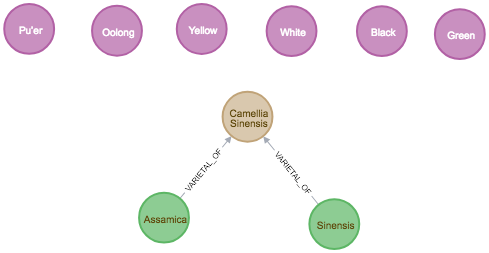
MATCH (t:Type),
(v:Varietal)-[vo:VARIETAL_OF]->(s:Species)
RETURN *
Most people are familiar with green tea and black tea, but actually there are six main types of tea. Each type of tea has a different production process, which might include withering, drying, roasting, fermenting, oxidizing, drying, etc.
Again, for these Tea Type nodes, there may be more detail you want to include as properties of these nodes, such as the production process used and the generally recommended brewing parameters (water temperature, steeping time, etc.) for each type.
Brewing a good cup of tea is an art, and no one wants to drink a bad cup of tea!
Many people also don’t know that all these types of tea come from the same plant, Camellia Sinensis, which has two main varieties: Camellia Sinensis Sinensis and Camellia Sinensis Assamica. Within each variety there are thousands of cultivars. Any drink brewed from a plant that isn’t Camellia Sinensis – such as yerba mate, rooibos and herbal infusions – are technically not tea, although they can still be very delicious!
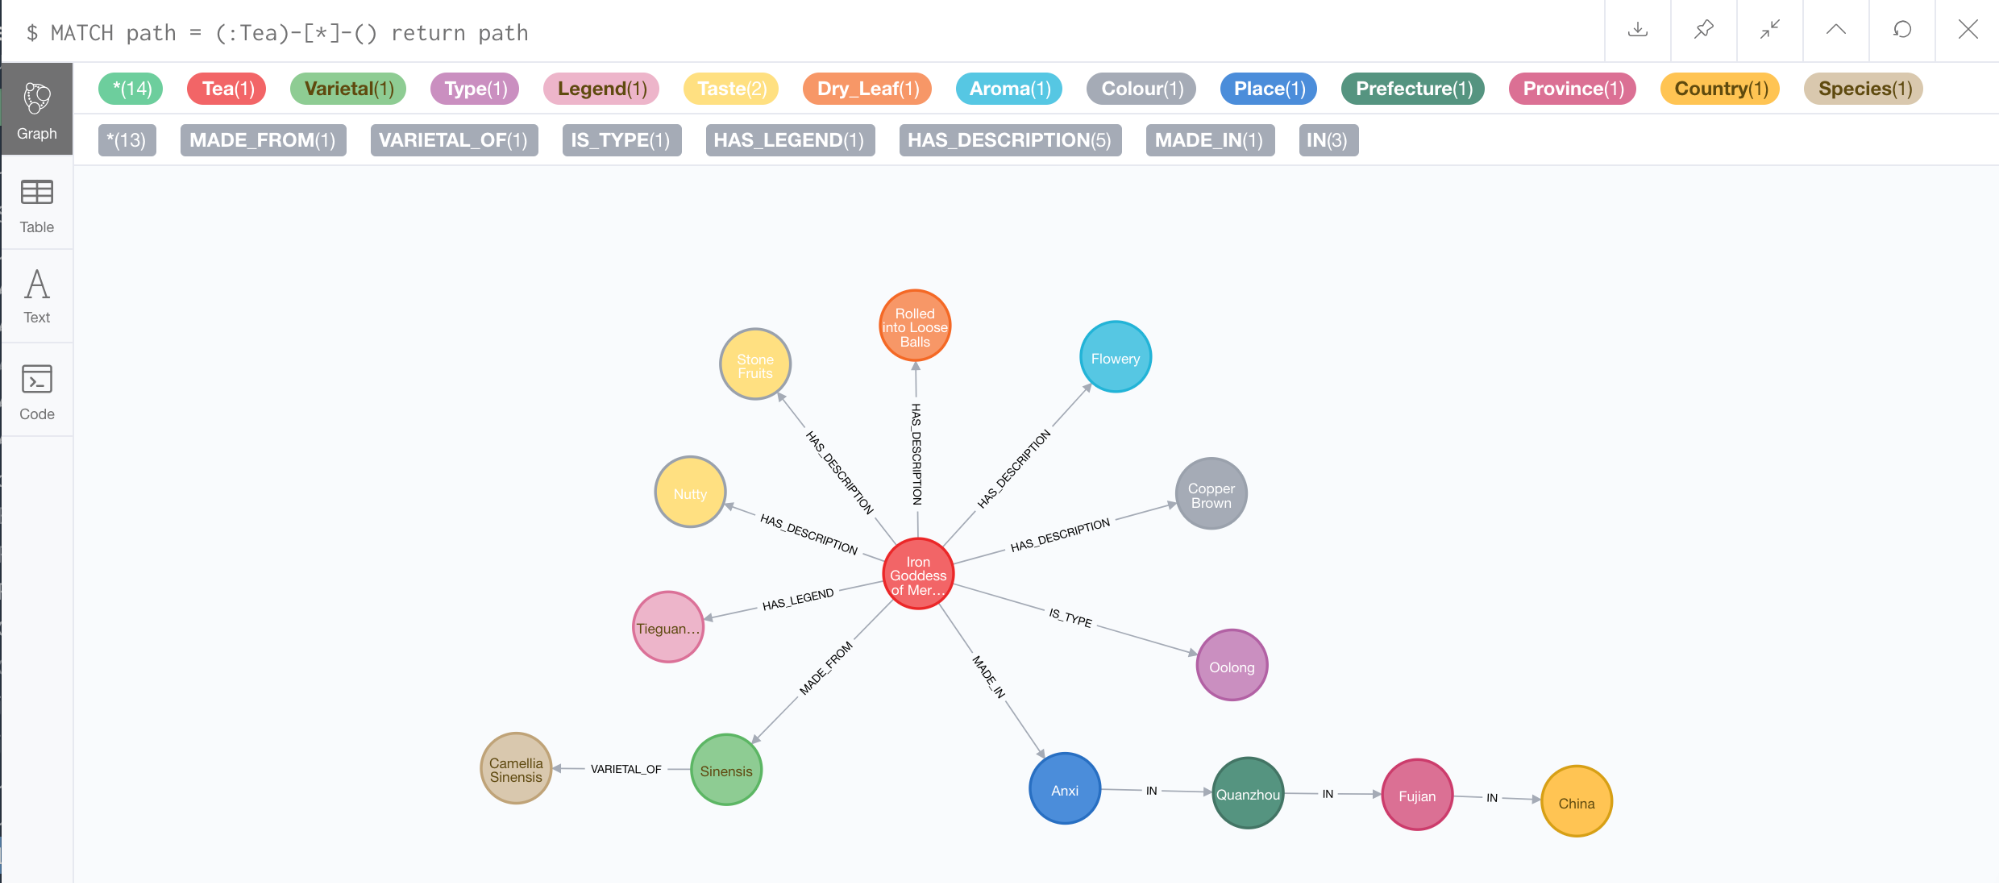
Now we have the basics in place for our graph data model, including both geography and tea. Next, we can start bringing them together and really get into more detail on specific teas. One of my favorite teas is Iron Goddess of Mercy (Tieguanyin or 铁观音), an Oolong tea made from Camellia Sinensis Sinensis plants in Anxi, China.
There are a few legends surrounding the creation of this tea, but my favorite involves a poor farmer who repaired a rundown shrine dedicated to the Goddess of Mercy, which he saw on his daily walk to his fields. The Goddess then appeared to him in a dream and showed him the location of a special tea plant. He made tea from this plant, which was of very high quality and made him very rich.
I’m going to start keeping an eye out for run-down shrines on my daily commute, though it’s unlikely my next career move will involve profiting from a secret tea garden I find in London!
We can also include tasting information and other descriptions for Iron Goddess of Mercy tea in our graph – such as notes about its flavor, aroma, color, how the dried leaves look and so on.
Can you see how our graph is really starting to take shape?
MATCH path = (:Tea {name: ‘Iron Goddess of Mercy’)-[*]-() return path
Obviously this is only one small example, and even for our Iron Goddess of Mercy graph we could include many more data points – more descriptions, details about its production process, specific recommended brewing parameters and even links to additional documentation or published articles.
The total amount of information you could store in a graph of all the thousands of teas in the world is very large, and – because the data is so complex and richly connected – it’s a great fit for a graph database like Neo4j.
This type of graph is usually referred to as a knowledge graph, because you can use it to represent and work with a large amount of knowledge about a particular domain.
This might be a specific topic (such as tea, famous people or beer) or all the knowledge that a company holds (about its products, services, customers, partners, etc.). Storing complex and highly connected information like this in a graph makes it easy to understand, to query and to use.
You might use a knowledge graph to power a search engine (“Show me all the Oolong Teas made in Fujian China” or “What legends are there about Chinese tea?”) or to make recommendations (“I like Iron Goddess of Mercy tea, what other teas might I like?” or “What tea with a nutty flavor and flowery aroma should I try next?”).
Knowledge graphs are also increasingly used to power cutting-edge technology solutions like chatbots and machine learning, where providing fast access to complex and highly connected information about a particular information domain is central to making these technologies useful.

Hopefully, you’ve learned a bit about both graph databases and tea from this post. If you’ve never tried Iron Goddess of Mercy tea, I’d highly recommend it – there are plenty of specialty tea sellers around the world so finding some near you should be easy. If you’re interested in learning more about the fascinating world of tea the UK Tea Academy has many fun and informative classes available, and you may also be lucky enough to have a tea subscription service near you. These can be an easy and exciting way to try new teas without having to buy (and find!) them in larger quantities.
Happy brewing and happy graphing!
Share Article


Explore
Related Articles


How to Improve Multi-Hop Reasoning With Knowledge Graphs and LLMs


