From collected data to connected data: How knowledge graphs are changing the world


18 min read
Brandon Richards – APAC General Manager, based in Kuala Lumpur, Malaysia, and Daniel Ng – Vice President of APAC, based in Singapore, are two of Neo4j’s most visible nodes. They sat down with Disruptive Tech Asia to talk about the current state of graphs, and what they see on the horizon. (Hint: There are graphs everywhere on the horizon.)
If you’re still not quite sure about the value and application of graph databases, this enlightening interview will give you a greater understanding of how this technology is used. Get insights into what industries have already jumped on the graph bandwagon, and learn what makes knowledge graphs in particular so powerful.
Enjoy!
Can you speak about the evolution of data, from collected data to connected data to knowledge graphs?
Brandon Richards: The relational database transformed business. Companies were able to collect a lot more data, put on applications like their ERPs, CRM – all kinds of different applications. It was a marvel of modern engineering, but I think people came to a point where they said, “one size doesn’t fit all.” It was very good at certain things, but they had to find ways to engineer around problems.
And so, that’s where we got the incoming of all of the No SQL databases. This is basically purpose-built databases to handle a particular problem that relational databases weren’t good at handling. I think there was a point where connected data specifically became still a major problem. All the No SQL databases were still using the traditional techniques and figuring out how to connect data.
Graph databases came as a part of that to address this problem and weakness of relational databases and other no SQL databases. This process has created a huge transformation in organizations being able to now ask questions that they just couldn’t ask before of their data. And so, data previously was just discreet data points. Now, they’re realizing the connections in the data are just as important and valuable as data sources. We need to leverage that in our organization for better insight and making better decisions.
Daniel Ng: If I may complement what Brandon has said – I’ve been in this industry for 38 years. I’ve seen it evolve from the myths of millions of instructions per second – MIPs. The younger generation probably doesn’t know that acronym, but I came from that era. What we’ve seen is, from a data evolution standpoint, we all know that the world produces data every second.
What we are doing today, recording this interview, is data being produced. When you now look at the explosion of social media and the internet – that actually fuels the whole production of data. Then it went through a whole series of moves and motions where it says, how do I collect data in a single place when you have now moved from structured data to unstructured data?
What is unstructured data? IoT [internet of things], signals, photographs – that’s unstructured, as opposed to structured data, where you fill up a form when you apply for your insurance policy. Everyone doesn’t really understand why there are squares when we fill out forms, and that’s 30 characters of names, 60 characters of addresses, one character of gender, and seven characters of phone numbers.
That’s structured because the computer expects it to be like that for every record. Now, you have, for example, somebody bumped into you on the highway, and you come down, you take a picture, and you will now claim insurance. How do you associate the unstructured data of that photo to the structured data of your insurance claim? I think that’s a huge challenge. And now, the birth of multiple databases, and we are all talking about speed in the internet world, how do you associate that together is going to be a huge challenge from a speed standpoint.
And then, you get scalability problems because you’re not talking about three people, you’re talking about three million people. 30 million people in Malaysia, for example. Enter “connected data,” which Brandon brought up, where we need to make sense of the relationship between candidate A, candidate B. COVID contact tracing is a good example in that sense, right?
We need to find out who has COVID who’s been near you, who has walked past you, who came close to who. You can’t do that over the course of two weeks because in the tables of rows and columns, it will take a lot of time to do that, which is the relational database that Brandon talked about. But graphs actually built the relationship between all those data points, and you can know it almost immediately, and be able to take action.
There are many, many great examples as the world moves from generational data to collective data, to connect the data where applications can now look at how we can use the relationship between data points to unveil the gems of knowledge within those data. We have proven it so many times with the Panama Papers, Pandora Papers, COVID contact tracing, fraud detection applications, to be able to show to the world what the use of connected data and the use of graph data platform is. Guess what? We’re just beginning.
If knowledge graphs are so capable, why aren’t companies all around Asia jumping on the opportunity to implement this technology?
Daniel Ng: You want me to take that first?
Brandon Richards: Sure. Yeah.
Daniel Ng: Who says they’re not jumping on it? They are.
Brandon Richards: That’s what I would say.
Daniel Ng: Right? And I think Brandon and I, on a daily basis, frankly on an hourly basis, talk to prospects who, at the start of every new technology, there’s always this learning curve. What is it? When Neo4j first started, Brandon, you and I know this, last year, the question was: “What is a graph data platform and who is Neo4j?” Just to add a little comic to it, people actually came to me and said, “Neo4j sounds like a password.”
And we go, “Yeah, it is the password to the locked data.” Did it lock the value of the data that you have? I’m going to let Brandon fill in the blanks here, but they are jumping on it. We’ve spent one year sharing with the marketplace in Asia Pacific on graph data platform and progressing to knowledge graph. People who see the value are jumping on it.
And certainly, everyone is seeing the value. Why? Last statement is a logical step to uncovering value from your data. It is a mind map of where your data should be going in terms of finding out what I don’t know, then finding out the answer to, now, what I know that I used to not know. And then, come up with better solutions for the customer.
Brandon Richards: Yeah. I absolutely back up what Daniel said about companies jumping at knowledge graphs. We are inundated with people who are very interested, who are starting to use knowledge graphs in a wide range of use cases. Very often, they’ll start with our free version, the community version, which is open source. They can come and start playing with it.
In fact, we’re finding all the time, organizations that we thought had never heard of knowledge graphs are using our community version for some project within the organization – so I think companies are. I think one of the areas that has led to a broader awareness in APAC is Gartner’s Top 10 Trends in Data and Analytics. In the last three years in a row, graph has been one of those top 10 trends. I think for organizations to actually read the report, they find that even though graph is only one of the 10, they’re talking about graph throughout the entire report.
I found that really, really interesting when they’re talking about explainable AI or data fabric or blockchain. All these sections, we’re talking about how they can leverage graph to do certain things. Graph was enabling a lot of the other areas, a lot of the other trends, that were in their top 10 trends. I view graphs as one of those super trends that’s enabling you to do all the things you want to do in data and analytics. Forward thinking organizations asking, “How can we leverage data? How can we get insight?” They’re going to analysts like Gartner and trying to figure out what they’re saying about where we should spend our effort or how we should get more value out of our data.
They’re getting pointed to knowledge graphs, so I think it’s happening. What are the blockers right now? I think it’s partly just educating them on: What is a knowledge graph? How do I implement that within our organization? How do we get more comfortable with it, and how do we improve our skill sets? But generally speaking, one of the benefits of graph is that it is very easy to pick up. At the developer level, at the practitioner level, data science level, they’re able to quickly come in, learn in a day…
Daniel Ng: No code.
Brandon Richards: No code. They can learn in a day what the basics are and really get started, so I think they are jumping at that opportunity.
What are some notable use cases of knowledge graphs in different industries?
Brandon Richards: I’ll take the first stab? Definitely financial services – you have things like fraud detection, anti-money laundering, type use cases, risk management, understanding complex entities – things that are real connected data problems. I want to stop the fraud before it happens. I need to automate that process and look for any of these 10 patterns in four milliseconds or less.
Along those lines, you have things like cybersecurity use cases. Then you go into manufacturing. They really want to understand these complex supply chains where you’re linking together all these different processes, or “What’s our bill of materials look like?” or “I want a complete view of my product” – which can be very, very complex.
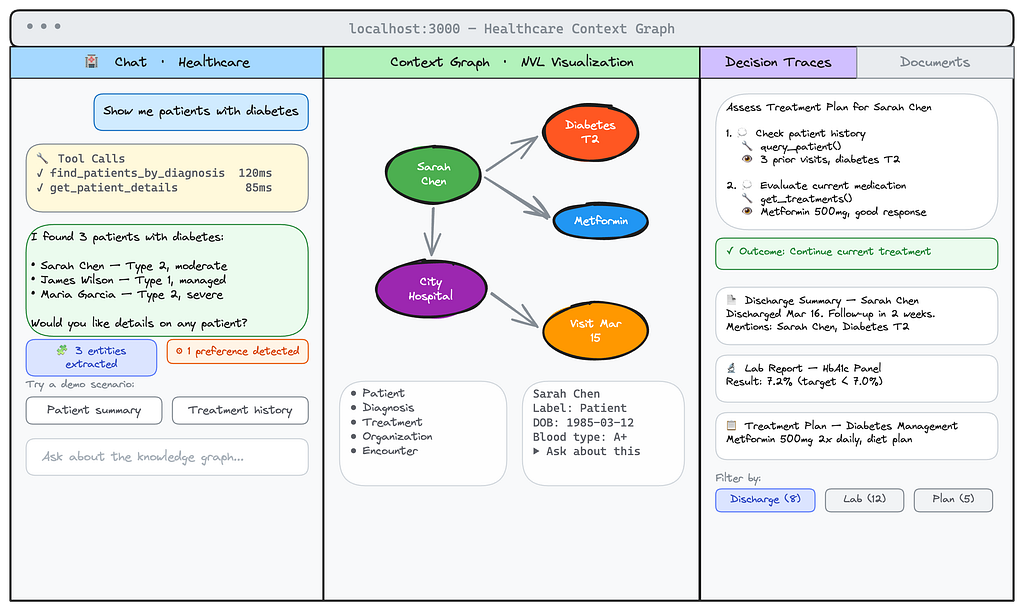
We also see making a difference in organizations like NASA getting to Mars faster, two years faster, because they were using knowledge graphs to answer questions that they knew existed. There’s also a lot going on in healthcare. Personalizing healthcare, figuring out who are similar people with similar paths and how we optimize outcomes for these patients. When you find similar people who’ve gone through similar things and what treatments and what things worked well for them, we can start to make optimizations. There’s a lot going on in healthcare.
I’ve already talked about manufacturing, financial services. A lot on the retail side. Recommendation engines, hyper personalization, dynamic pricing engines, all of these types of things are coming back to the need for information in real time that’s complex and connected, to be able to make quick or even automated decisions.
We see those types of examples. If you’ve booked a flight recently, almost certainly, Neo4j was used as a part of that process. If you send a parcel someplace, almost certainly, Neo4j is used in routing calculations.
Daniel Ng: You buy a book at Amazon. You get the “People who bought this, bought this book as well.” Guess who’s that? That’s us in the back end. I think only one thing I would like to add is we’re not industry-specific. We’re use case specific. When Brandon talks about fraud detection, many people will jump and say banking. Yeah, but guess what? Who else is coming to us? Online game companies. In the COVID situation where you can’t go and have fun at the casino, you do it online.
When that happens, a lot more fraud happens. And lately, to your retail example, we also see people coming to us and going, “We’re a retail outlet or retail portal. Can you help us with fraud detection?”
For me, I scratch my head and say, “You’re not a bank,” and it teaches me to say, “This is a use case that’s horizontal.” You see applications in different industries.
What differentiates one graph technology from another, and what should companies look for when choosing the right solution?
Brandon Richards: Can I jump on that one?
Daniel Ng: Sure. I know you want to.
Brandon Richards: Look, we love the fact that a lot of organizations, a lot of companies, are jumping into the graph space. If anything, it validates that it’s real. This is here to stay and it’s going to be a big thing. With that, we have a lot of new companies trying to jump into space. I think the first thing they all do is point towards performance speed.
We need to be fast. We need to be faster than anyone else. At Neo4j, one of the big lessons we’ve learned is that reliability, data reliability, especially in a graph, is critical. You expect a database to store data, retrieve data, and keep that data safe. And if it’s not keeping the data safe, that’s a major issue. With everyone focusing too much on performance, oftentimes that comes at the cost of data reliability.
So that’s one of the big issues we see. Almost every company that’s getting into the space is so hyper-focused on performance and scalability that they leave this third and critical part behind. For us, we see being able to keep data safe and not corrupt your database is critical. Now in a graph database, data corruption would be a much bigger problem than in any other type of data store. I’ll illustrate this way. Suppose I corrupt one piece of data in a relational data store. The only query that’s going to impact is a query that’s looking for that particular piece of corrupted data. In a graph database, if you corrupt one piece of data, it’s going to corrupt any query that touches that piece of data. I want to know the shortest path between this and this. Your answer will be wrong.
And so, it can impact thousands of queries, not just a single query. Corruption in a graph database is devastating and it’s absolutely unacceptable. What our focus has been, from an engineering standpoint, is ensuring that we are hyper focused on going as fast as we can without sacrificing reliability. We will scale as much as we can without sacrificing reliability. But if it’s ever a trade off, we’re always going to pick reliability. I think that comes with the maturity of the one who came in first. Everyone else has not learned that lesson, or they’re learning that lesson very quickly as they get into real production environments, and companies are saying, “Wait a second, our data needs to be safe. If you can’t keep our data safe, we see it…”
Daniel Ng: It’s useless.
Brandon Richards: Yeah, it can’t be a proper production environment. For most organizations, they just won’t stand for that.
I think that would be the one key thing if I was looking into the graph space. I would very much want performance and scalability, but I need to also be checking for data reliability. I would add to that, just because the company says their data is secure and they’re an acid compliant database, doesn’t mean it is. You have to test it. Your POCs and things like that, absolutely test for data reliability, because that’s critical.
Daniel Ng: Brandon’s being humble. Besides the data security piece, we are performing very well in the scalability and the performance side. We have proven, using real data, that we could process 1.2 trillion, not billion, 1.2 trillion relationships in 20 milliseconds.
Now, talk to me about scale and talk to me about performance. I’ll leave it at that.
Brandon Richards: If I could add one last thing, Daniel, I would just say, our real customers in the real world are using massive graphs at massive scale, massive performance, so just because a vendor will run a performance benchmark and somehow there comes out… We get all kinds of claims, a thousand times faster or whatever, almost always… Yeah, it’s pretty much garbage. That’s what we found.
Daniel Ng: He will quote you.
What are Neo4j’s plans for the APAC region?
Brandon Richards: Look, we’re growing as a company faster in APAC than in any other region in the world. We are growing at a very rapid pace. We’re hiring at a very rapid pace. If you know someone, someone that has skills we can leverage, I’m sure we’d be interested – we are growing at a very fast pace. We’re adding lots of big company brands that everyone would recognize.
Companies like, here in Malaysia, Air Asia has migrated, wanting to find an innovative way of delivering more personalized service to their customers. You’ve got big banks. We’ve talked about a lot of the big banks in the region also jumping at the opportunity to leverage this. We’re seeing a huge adoption in banks, governments, manufacturers, retailers – you name it.
Gaming companies, life science, they’re all jumping on the opportunity. I think that speaks to the fact that APAC is ready for graph.
Daniel Ng: The only thing I want to add is Neo4j believes in managed growth. We’re not a company that comes in here and hires 20 people this year and five or 15 the next year. We have to have a sustainable business for the sake of the market that we serve, for the sake of the customers that we serve, for the sake of the partners that we collaborate with. And more importantly, for the sake of the nodes. We call ourselves nodes in the graph, in the APAC graph, to be fair and to be respectful of them. We grow in leaps and bounds, but it’s grown within the context of, will the business be sustainable in the next three, 5, 10, 20 years? With that in mind, we grew the company many, many times in 2021.
Brandon Richards: Yeah.
Daniel, you’ve recently been named one of the top 100 Power Leaders in Marketing and Communication; CMO Council board member, and VP of Marketing for APAC. Can you speak about these accolades and what they mean to you?
Daniel Ng: Firstly, I’m humbled and grateful, and surprised that actually people know that I exist in this world. But it really is a testament of 38 years of contributions, and also learning from the marketplace, working with great colleagues like Brandon and tons of good friends in the marketplace. They always say the guy or the girl that wins the award is the one standing on stage, but they don’t see the whole village of people that stands behind the person to get them to where it is.
I think that is what it is. It’s a reflection of not just me, but a lot of the support that I’ve been getting, a lot of the recognition from companies like Neo4j that I’ve received. Very importantly, my mantra is to learn, to contribute, and to be happy doing the first two. The rest is the rest, I guess.
Brandon Richards: It’s well-deserved. I can assure you. He’s doing excellent work.
Daniel Ng: Thank you.
Brandon Richards: I appreciate the opportunity to talk about graph today and what’s happening here in APAC. I look forward to answering people’s questions or helping them on this graph journey. That’s what we’re here for.
Daniel Ng: To all the nodes in Malaysia and also Indonesia, I’m sure this will reach there. Thank you very much for Asia Online Publishing Group for hosting us today. It’s been great. I think the last note is: Open up your mind. There is a bigger world out there for your data. It could be a fabulous tool that integrates everything. But be prepared that you may actually find things that you don’t like, and you may also find things that you love, like many of our customers – we provide you with the technology to find the value.
Through that exploration, you will see what you have, what you don’t have, and at the same time, make decisions on how you will progress. Lastly, try to make graph a humanized technology. Apply it from a mind mapping and a logic thinking perspective. I think with that, everyone will prosper.
And as Brandon says, feel free to contact us at [email protected]. Neo4j.com will be your source of information for a lot of these things. Thank you so much, AOPG, for helping us talk to your audience.
Share Article


Explore
Related Articles

Neo4j Named “One to Watch” in Snowflake’s 2026 Modern Marketing Data Stack Report

POLE+O: The 5-Type Ontology That Solves the Hardest Part of Building a Knowledge Graph

1 of 3: The difference between a graph, a knowledge graph, and a context graph
