
How Knowledge Graphs Drive More Sales With Real-Time Recommendation Engines

Vice President, APAC
17 min read
Are you familiar with knowledge graphs? What about graph technology in general? If you’re in the retail business, this presentation could be a game-changer. I explore the myriad ways knowledge graphs can transform your business and share some use cases of how some of today’s leading retailers have used this technology to enhance the shopping experience, gain deeper insights into their customer portfolios, and ultimately increase revenue.
You don’t want to miss it. Dive into the details below and start transforming your business today.
Nik Vora: Hello everyone! My name is Nik Vora. On behalf of everyone here at Neo4j, I welcome you to “How Knowledge Graphs Drive More Sales with Real-Time Recommendation Engines.” It is my pleasure to be here. Now, let’s look at some of the events that have happened in recent times. We’ve always lived in a hyper-connected world. For centuries and centuries, we’ve all been connected. Be it people, be it assets, be it connections, be it the universe or our movements – in recent years, the outcomes of these connections, and the outcomes of the impacts of these connections, have become very, very real. You’ve probably seen all the headlines around the ship that was stuck in the Suez Canal.
The ship went free within a few days, but the impact lingers on even today. You would have seen stocks sink because of an event somewhere else – somebody cuts production targets, there’s a supply chain chip shortage. And the gas effect is everywhere. In fact, even the state hardware availability projects set to go live are in the queue pipeline because there aren’t enough chips, there’s not enough hardware, there’s not enough deployment where you can run a lot of things that you want to.
From automobiles to every other sector, healthcare, medicine, etc. – everything is impacted because of supply chain issues. And these issues have brought to the forefront how all of us are connected. No one is escaping this – isolation that happens in a different part of the world has a real direct material consequence on how we run, how our business is run, and how our customers experience our services.
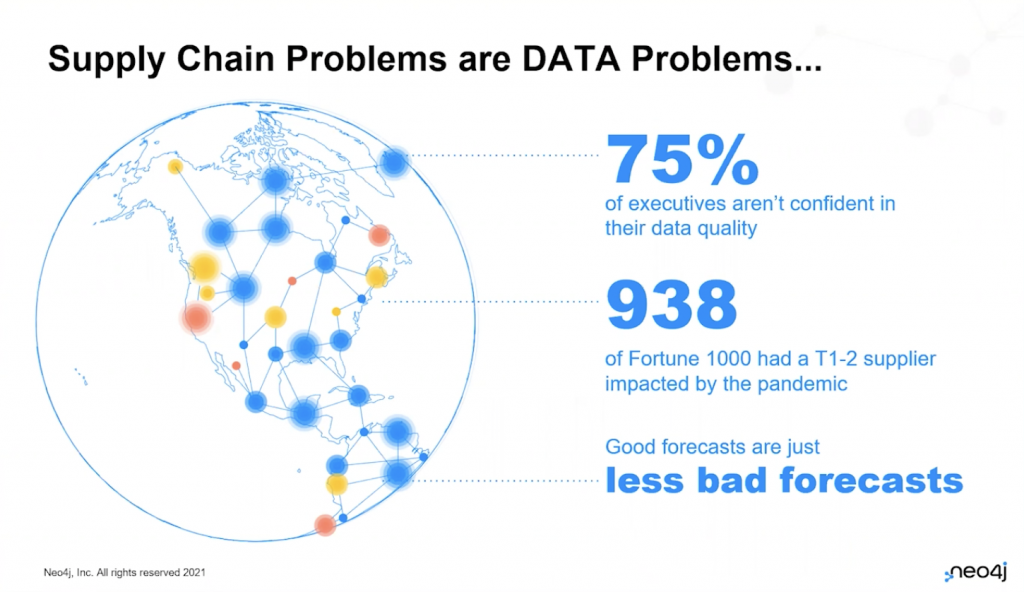
A lot of these supply chain problems, if you really think about it – these are data problems. Now, using ineffective manual processes, we can get supply data. More than 75 percent of executives in research do not feel that they’re confident in the quality of the data they have, and more than 938 of the Fortune 1000 have had a T1-2 supplier problem during the pandemic. A lot of us know in the retail space, if you’re running a mall, if you’re running hospitality service, if you’re running a fashion retailer or any other retail, we all typically know our Tier 1 Supplier, but the Tier 1 Supplier is dependent on the Tier 2 Supplier, who’s dependent on the Tier 3 Supplier and so and so forth.
And an impact on the Tier 3, 4, 5th level of supplier cascades onto us and onto our ability to solve for our customers. More than 938 Fortune 1000 companies realize that they don’t have visibility into the Tier 2 onward suppliers, and their business is at critical risk due to supply chain delays.
And forecasts – good forecasts, bad forecasts – are equally inaccurate. The poor supply data is costing us millions, it’s costing poor decisions, ineffective operations, logistics, and a lot more. And all these complex problems are really data problems. How can we increase visibility into better data quality, better data insights, and better data analytics because of the connected nature of the world that we live in?
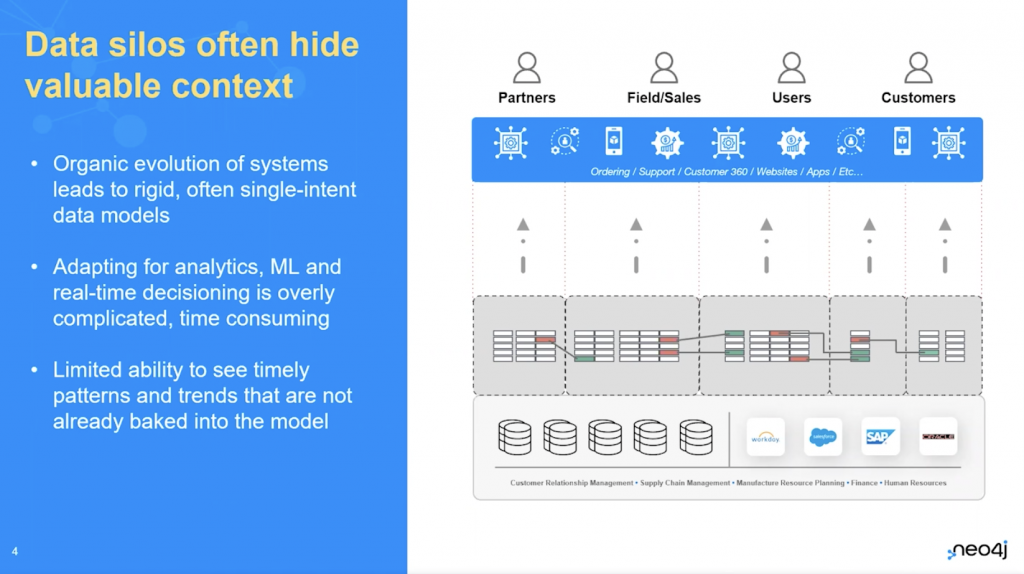
Let’s take a second and review the typical architecture that a lot of our internal IT systems have. IT systems over many years have organically grown, but they have grown during a time when times were simpler and data was very simple to put into roles and columns. It was structured. The last 15 years has seen a lot of unstructured semi-structured data coming our way, a lot of connected data, a lot of mobile mobility data coming our way. But before that, all the systems that we typically use were designed and built before all of this happened.
The relational databases and applications around relational databases – be it your CRM, be it your SCM, be it manufacturing planning, or human resource planning, your store inventory – these are all in multiple silos and they don’t necessarily talk to each other in the same dynamic way they do in real life. In real life, a customer can have an impact on your inventory management, on your supply chain management, on the CRM, etc., in real time. But those connections are not visible because our systems often have single intents. They were built with one particular intent – it’s either a loyalty system, an inventory system, a merchandising system – they were built with a single intent and they’re often rigid in that intent.
And when we ask our data teams and data scientists to create more insights, more information from these systems, they struggle to get the context. Context is extremely valuable when trying to make a business decision. If a customer’s walking in on a particular day and buying a particular product, the context of how that customer came in, why the customer’s buying that particular product – is it a particular demographic that has a particular buying range that has a particular color selection?
Are market factors like a festival or the location or something else dictating the choice of the purchase? Is the supply chain dictating the choice of purchase? Was it unavailable elsewhere, which is why they came into your store? How is all this context important? And with all the context, how do we direct that from the rigid, single intent systems that we have today?
All of this sounds great. And often when I talk to CIOs, it seems unrealistic. A lot of CIOs ask me, is there a success story? Has someone really transformed their entire business? Is it realistic to get value if we have context in every part of our retail business?
Now let’s look at a very, very prominent example. Figuring out how to extract the deeper context from data has helped Amazon tremendously. Amazon has possibly one of the most complex inventory systems globally. They have products in many, many different categories and verticals. They have products that are premium, and that are in the lowest price range. They have products for bachelors, kids, toddlers, adults, life care, across systems. Their customer base is also complex, and so is their supply chain from warehouse to delivery. They are using context to drive so many decisions. They’re using context by connecting all of their IT systems.
They’re transforming the customer experience. They’re transforming the way the customer searches for products. They’re transforming the way the customers are recommended products, and they’re transforming the way customers eventually receive the products. You can see benefits, and it’s not restricted to Amazon. Let’s look at LinkedIn, let’s look at Facebook, the rise of the social crafts for all of us who have enjoyed connecting with an old friend or connecting with someone important. Eight out of 10 people with a career today have had a positive impact of using a tool like LinkedIn to find their next job.
If you look at the examples in network science, we are all much more likely to find our next pay raise because of someone we know, and not because of something we did. Something we did is absolutely important, but the power of your network on your next promotion, your next pay rise, depends on the kind of people you know. As the old saying goes, “It’s who you know, and not what you know.”
If you look at Google PageRank, Google revolutionized search when it came about – it was exciting, it was fast, it was vastly more accurate. Google’s PageRank is really an application of graph technology that creates much more context in the search. Oftentimes I hear my family – who don’t come from a technical background – say, “How does Google manage to understand what I am really looking for?” And the answer is context.
Look at PayPal, securing peer-to-peer transactions, look at drug discovery or eBay and changing the way you experience product searches, changing the way you get same day delivery. A lot of these interesting and exciting applications have transformed many applications globally.
Over the last two years, a report by McKinsey has said that irrespective of the location, irrespective of the geography of the country, ecommerce as a percentage of total retail sales has dramatically increased. Be it in Indonesia, Australia, Singapore, India, China, U.S., Germany – people are seeing a two to 10 times increase in how important ecommerce is. As a retailer, as a hospitality provider, have you factored in how you’re going to cope? Ecommerce until 2019 was possibly one or two or three percent of a business. It’s now six, eight, 10 percent of your business.
If you can invest more and create much higher traction in this part, this could potentially safeguard your losses from the offline segment. The virus hasn’t completely gone away. We are all evolving into a new normal where a hybrid seems to be the norm. Is your organization, the customers that you’re serving internally and externally – have you organized around the kind of investment that ecommerce will now need to keep up with your competition, and the experience that the customer now believes is the bare minimum? The bare minimum two years ago was just, “I go to a website, I search, I get something, I get it within five, six days.” And it’s good enough.
The experience of ecommerce is now drastically different. If I go somewhere, I expect the website to be easy, I expect the website to be intuitive, I expect very little effort to search for the product I’m looking for. I expect the website to recommend the right configuration, the right options, and I expect the delivery to be quick, easy, and simple. This is the new bare minimum and with the share of sales from ecommerce going higher and higher, it is a strategic requirement that we address this.
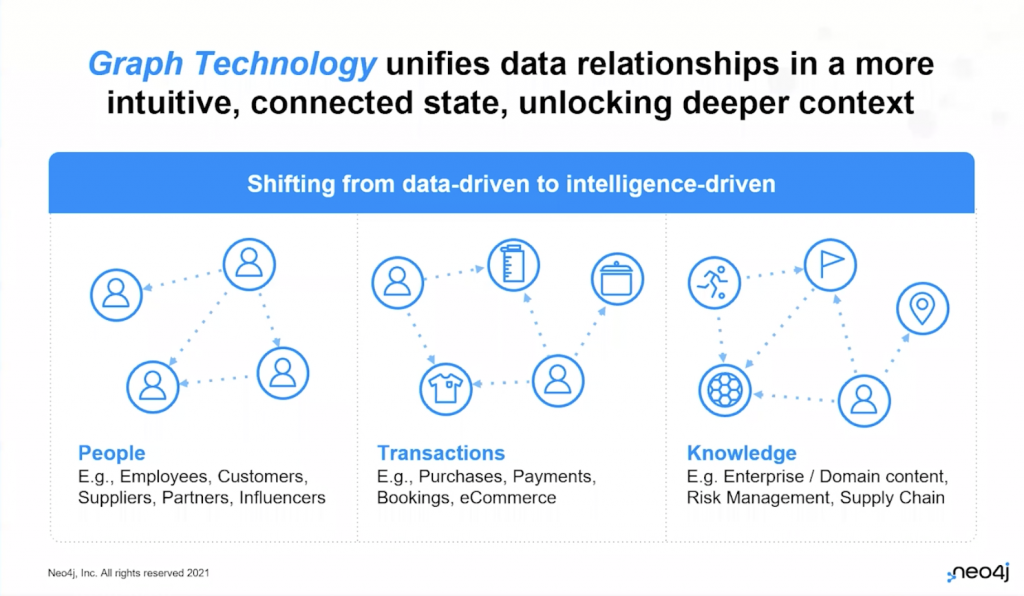
Now, why should graph solve this problem for you? Graph technology fundamentally unites data relationships in a very intuitive and connected way, with deeper context. Graphs are the natural way to think. It’s also the natural way to store data, and it’s also the natural way to analyze data.
If you’re ever looking at a graph of people, if you ever try to explain to someone in your friend’s network how you know someone who knows someone else, and you try to scribble that on a piece of paper, you are likely drawing a graph. If you draw a map, a customer journey map, a customer life cycle map in those ideation workshops, when the customer first interacts with your company in an article, in an advertisement, or from a friend or a referral, and they go to your website, then they go check other things – that is a graph. It’s a graph of their journey of interacting with your brand. At each stage of the journey, they are in a different phase.
Understanding the journey, understanding that graph, helps you customize and improve your probability of the customer moving to the next stage and the next stage, eventually leading to a transaction. And when you merge and combine all these multiple graphs with different semantics on top of each other, what you get is a knowledge graph. A knowledge graph combines information, not just from a single intent people graph or a transaction graph, but from multiple domains. You could overlay your entire supply chain network availability along with inventory and customers’ past transactions, customers’ clickstream data, all of it – because in reality all of it is connected.
You don’t want to show recommendations in real time for a product that just went out of stock. You don’t want to recommend a product that has a 25-day delivery. How do you map all of this into real time recommendations, to a place where your customer has a wow experience, and just wants to go ahead and make a transaction?
Graph technology globally is experiencing accelerated momentum. Gartner, amongst other analysts, have anticipated that applications using graph will grow at 100 percent throughout 2022 and up from 4 percent adoption – we are likely to hit 30 percent adoption. If you are not considering graph right now, it is very likely that others are seriously considering and adopting graph technology and creating a possible competitive advantage.
Graph technology is helping in multiple sectors. There’s decision analysis, which could very easily be merchandising forecasting, understanding which merchandising to focus on, understanding customers’ past journeys, or in other segments. It could be the customer’s experience, be it an omnichannel experience, be it an in-store experience or a marketplace experience. Something of an online marketplace or an offline shopping mall marketplace. It could also be data unification.
Oftentimes we have customer data coming in multiple locations, but it’s never the same and it’s never completely clean. The days where we dreamt about 100 percent clean data, consistent data from all data sources, are gone. The reality is we have so many systems the customer interacts with that we have to find new innovative ways of understanding who’s our customer. If the customer’s using the shopping mall WiFi and transacting at three different stores, they may not use the same device. They may not use the same credit card or the same mobile number.
For us to find a way to say this was one customer, this was one customer family, creates a lot of business value, and that is something graph does really, really well, right from the personalization on your website to in-store and discovering more.
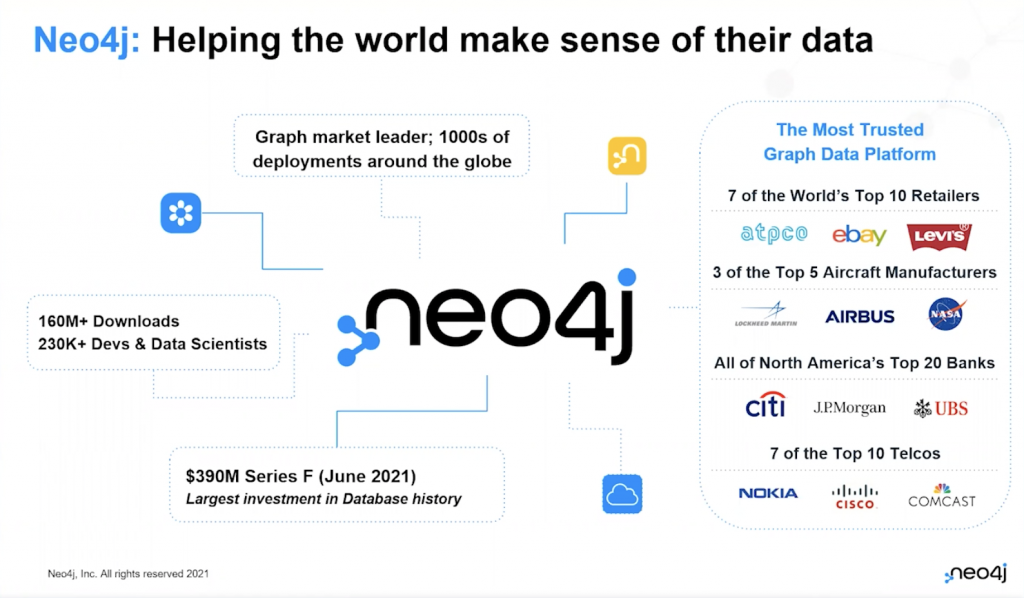
Now, who’s Neo4j and why should you pay attention to anything we are saying? Neo4j is the name that put “graph” and “database” together. More than 230,000 developers globally are part of the Neo4j community. These are trained certified developers, which means if you are looking at a business transformation and you are looking to adopt a new technology, you will always find people with Neo4j skills.
Neo4j is also loved by investors, partly because of the commercial and community success that we have. Neo4j recently raised over 300 million, which was by far the largest investment in database history, ever. We are very thankful and we are very humble about it, but we also take pride in the fact that investors globally – including the top investors from the U.S., Europe, and other parts of the world – gave us the biggest shout-out ever, creating a milestone behind which all of us can create more, better products and more use cases working with all of you.
We have more than 160 million downloads, and there are thousands of enterprise customers that have deployed this across the globe. Seven of the top 10 retailers are with Neo4j. This includes Amazon, eBay, and many of the popular names like Walmart. It includes three of the top five aircraft and all of North America’s top 20 banks. It includes many of the top banks here in Singapore, India, Australia, China, Hong Kong, and more, many of the top telcos in APAC, as well as globally and many prominent names.
Neo4j is also leading at the absolute top with Forrester, as well as with DB-Engines. Those who are very familiar with the developer network, you would know that DB-Engines is the gold standard for understanding which database service is the most loved, adopted, and trending. And it’s a good source for developers to be trained on the best. DB-Engines has put Neo4j as the number one graph platform for many consecutive years in a row, and so have analysts like Forrester, Gartner, and others. How does this fit into your stack? Does this imply that you have to rip up and replace everything that you’re doing today? Does this need a massive change? Do you have to buy new hardware? Do you have to hire more people? The answer is no to a lot.
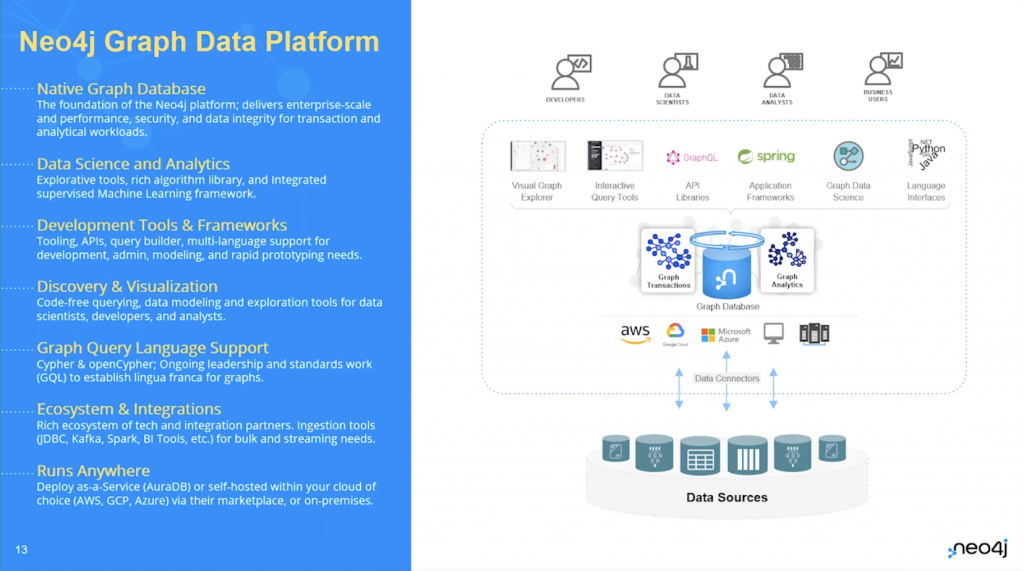
Neo4j fits in really well with the existing systems you already have. You could connect this to all your different data sources. If you are running your service in the cloud, this is available in the cloud with multiple options. This runs on-premise in private data centers, in hybrid setups, in all virtualized setups. This is available where you are and where your data is. It can connect to all the different data sources, right from relational to other noSQL technologies, as well as the latest ecosystem of popular open source tools. We work with Kafka and Spark and Hudu and all the technologies that top retailers are investing in.
Neo4j has three broad categories: the Core Database, Neo4j Graph Data Science, and Visualization for those finer experiences. All of this is available as a service where you are for different users within the organization.
What are some of the real-time recommendation use cases that our customers have deployed? Use cases can go from SAP to eBay, to dynamic pricing systems by Marriott or inventory systems by Walmart, Nordstrom, etc. There’s also a ton of applications across different verticals that are very applicable to retail as well. If you look at Master Data Management, retail has a major challenge with data silos, data coming from different systems, and the need for IT – especially the people who are responsible for governance, privacy, and compliance security – to understand where your data is. And if a customer requests the data for it to get deleted, there’s always new products being created within your tech landscape.
Sometimes it’s difficult to understand where your customer information is. Graphs are a perfect, natural way for you to get speed and agility and simplicity in complying with the Personal Data Protection Act. If you look at Identity Access Management, data is available across many different stores, and many different partners can be delivery partners or store partners or supply chain partners. How do you ensure data is only available to the right party to the right entity at the right level to the right level of access? And graphs, again, are a perfect way to manage your identity and access, trusted by the biggest retailers and the biggest banks to rely on Neo4j for the governance risk and compliance.
Coming to the real-time recommendation, a very interesting use case is from eBay. eBay, amongst other things, wanted to create a much better experience for customers trying to search for their product. Ever since Google became super successful using graphs for search, “search” has become synonymous with “graph.” If you’re trying to improve search, a basic noSQL technology is just no longer sufficient. If a customer wants to buy a men’s leather calfskin leather bag for under a hundred dollars, it’s not enough for you to have a relational database or keep a tag under bags.
This is a search query that needs to be broken down into a graph to give the best recommendation on the front page to understand exactly what the customer might need. The customer may have been searching for vegan sustainable products on your own website for the last 10 minutes. And you would then be sure not to show leather products. You might show artificial leather products, for example. So the context of the customer’s experience with eBay or your website, and using that as part of the search in real time – connecting to all the different data silos, be it the inventory, catalog, supply chain inventory, etc, and showing the best possible recommendation front and center – was a big challenge for eBay.
eBay wanted to search through more than 20,000 products, more than 150,000 attributes. And it was very difficult to provide that. So eBay chose Neo4j as the native graph database that holds all the probabilistic models and they use this with Google assistant. So if you ever try any Google assistant, you can say, “Let me try eBay.”
And the voice search that you might use over there gets fed into a Neo4j-based system first, where it uses natural language processing, creating a search string that gives the best possible recommendation. And those recommendations have to be so highly trained, because you’re using an interface like Google assistant, where you don’t have the flexibility of showing multiple products and clicking here, clicking there. In this exchange, it is important that you show the best product first because it’s a voiceover. And that is what eBay was able to achieve with Neo4j for the Google assistance products.
Now let’s look at Meredith Corp. Meredith Corp is a very interesting use case, because so many of us over here struggle with the concept of a truly unique customer 360. We know we have family as customers, we know we have couples, we have parents with kids, we have grandparents, large families, bachelors, kids, etc. But how do we connect those dots? It is very difficult, right? And there are organizations that have an online presence, have an in-store presence, have a mobile lab, have a call center, Twitter, etc. There’s so many data sources. And it’s very difficult to understand who your real customer is.
What Meredith Corp will do is take anonymous data – just cookies, nothing else. Most of you have a lot more information, not just cookies, but a lot more, but even with something as simple as cookies, they were able to convert 14 billion anonymous data points into 163 million unique profiles. Just think about it. 14 billion data points converted into 163 unique profiles. And that is just with online experience cookies.
Now you add all the other information that you have. Let’s create a knowledge graph around that, and add in all the transactions, newsletter signups, and everything else. Everyone who signs up for WiFi in your store, anyone who ever browses your online ecommerce website after logging in, anyone who has a shopping cart, who has a wishlist – all these data points will just add more richness to these 163 million unique profiles tol give you a way more accurate count. At the next quarterly meeting or at the next campaign that you run, you have a much better understanding of who your customer truly is and who the influencers are within your customer base.
If you lose an influencer, it is said you will lose 40 other customers, so it’s hyper important that we know who the influencers are. It’s also important to know who’s closest to the influencer and who’s farthest away so you can use data science in how you approach your customer service. You can get your call centers to see if an influencer calls, using Neo4j to pop up the information to the call center so that they can provide special love and care. Using data science in customer service and campaigns and more is now a critical, but very easy to deploy, tool. Thanks to Neo4j graph. To all my business leader friends who are out there and trying to understand if this is value for money, the Forrester economic impact study, where tons of customers with existing deployments were surveyed, mentioned that there was a 417 percent ROI.
Neo4j paid off more than four times within a span of three years for the cost of investment. In the software, in the people, in the time, there was a 2.2 million increase in revenue, a 60 percent faster time to market, time to value, and more than 1.8 million in savings. Graphs are not only making you more compliant. They’re not only reducing your hardware footprint, they’re helping you save costs, stay compliant, and also helping you increase revenue.
With these solutions being able to run where you are, we are very confident – through our partner network, existing customers, and more than 230,000 developers in our community – there’s a lot of value for your organization and use cases. You can create strategic, competitive advantages using graph technology and pivot from being single intent architectures to connected architectures.
Share Article


Explore
Related Articles

How to Improve Multi-Hop Reasoning With Knowledge Graphs and LLMs


