Leveraging data science tools for fraud investigation
Private Investigatory, Starrett Consulting
17 min read

Editor’s Note: This presentation was given by Paul Starrett at GraphConnect New York in October 2017.
Presentation summary
This blog focuses on how to take advantage of certain actively used data-science tools synergistically, and how to use a graph database as one source of research and information representation. As a bonus, most of the exploratory efforts presented today can be used to inform predictive analytics across industries.
Let’s start off by going over the basics of big data and data science. Big data presents a lot of problems: It’s often too voluminous, complex or fast-moving for conventional methods to handle. Luckily, we can find our solution in data science, an interdisciplinary field about the scientific methods that can be used to extract knowledge from data.
Private investigators have to sort through a huge volume of information, and it can often be difficult to know exactly where to start. However, relying on anomaly detection, which helps abnormal behavior stand out, and predictive analytics, which relies on historical data patterns to help predict fraud, provides an excellent starting point.
Converting all of the information at your fingertips into structured data, developing a searchable database, and creating relevant graph visualizations help bring you even closer to uncovering the relevant data you didn’t even know you were searching for.
Full presentation: Leveraging data science tools for fraud investigation
This blog centers on how to use data science, machine learning and Neo4j to develop a searchable database that can be used for many purposes, including uncovering fraud:
Starrett Consulting is a full-service, Silicon-Valley based investigations firm that also consults in information governance, compliance and threat detection.
Today we’re going to focus on the actual investigations, for which we leverage all types of tools: Neo4j, Elasticsearch, Solar, LESS and open-source APIs, mostly Python. One thing I want to point out right off the bat is that we don’t sell analytics – we sell information.
I’m a licensed private investigator and attorney with a Master of Science in Predictive Analytics that I completed last year. I’ve been working mostly with Python and the Apache project tools, but first and foremost, I’m an investigator.
Let’s go over a few things this presentation is not.
This is not how to find fraud using a graph database, to discuss how many clusters you have, or to go over how quickly you can make a query or a JOIN. This presentation is about how to use data-science tools synergistically, and how to use a graph database as one source of research and information representation. As a bonus, most of the exploratory efforts presented today can be used to inform predictive analytics across industries.

We’re going to start with big data and data science to make sure we’re on the same page in terms of definitions, and then we’ll move more specifically into fraud investigation. This will help us answer the question: What things do we use in data science and electronic data to help us focus on where we need to be?
We’ll also discuss fraud and conspiracy, collusion and conflict of interest, which is where graphs are really the most useful. And finally, we’ll go over a real-world example via a configuration that is used fairly commonly.
Big data and data science
We know that the use of data science, machine learning, predictive analytics and artificial intelligence are some of the most important aspects of remaining truly competitive as a company. This is especially true in the areas of compliance and fraud, as well as in any field that is governed by legal requirements.
We define big data as data that is “out of hand” – too voluminous, complex or fast-moving for conventional methods to handle. And what do you do if your current methods can’t handle that data? You can find your solutions in data science, which is defined as “an interdisciplinary field about scientific methods to extract knowledge from data that involves subjects in mathematics, statistics, information science and computer science.”
I like to say that big data is the rain, and data science is the umbrella. The most important thing to note is that data science is contextual, and can be applied to everyone’s use case, which I’ll get to in a bit.
My business is information – and I often don’t know where that information is going to be, so I have to think about all types of data: quantitative, structured, unstructured and qualitative. I personally maintain more of a jack-of-all-trades manager and then bring in PhDs if needed, depending on what I need to do to marshal my case forward. Most of the data science tools I use are for lead generation, so I know where to focus. Every insight and generated lead requires follow-up and corroboration from other sources.
This is a very rough definition of the four different types of data:

In order for all types of data to become useful in the context of data science, unstructured data needs to be transformed into structured data, and we have to apply numeric aspects to qualitative (or categorical) features.
For example, we could add numeric values that describe how far apart two specific words are in a document, or how dense a document is.
Fraud investigations
In fraud investigations, we consider all sources of information, which includes:
- Interviews and interrogations
- Surveillance
- Social media, web data, video and audio
- Financial records
- Physical records (paper documents)
- Graphs, etc.
All of these different types of data are used iteratively and in various permutations as a case grows.
The three-step process
Uncovering fraud is a three-step, sequential process:

When I talk to a client, first I need to become familiar with the relevant law, policy and priorities.
Next, I need to determine what data I need in order to fulfill what is being requested, and whether or not to use a data science tool. When we do use a data science tool, we keep it simple so that we can explain it to people without technical backgrounds.
Anomaly detection and predictive analytics
Fraud is typically uncovered in two key ways: anomaly detection and predictive analytics:

When you don’t know anything else, you use anomaly detection. What’s weird? What doesn’t fit? With predictive analytics, you use fraud samples and non-fraud samples to create patterns that help you determine whether or not incoming data might indicate fraudulent activity.
Let’s look more closely at anomaly detection using standard deviation, which is the average distance from the average. If we had a room full of people, half of which are 30 years old and half of which are 50, the average age is 40 with an average distance of 10.
Let’s consider the following example, which has one numeric variable:

With anomaly detection, we’re trying to determine – what isn’t normal? What is outside the standard deviation?
The blue horizontal line indicates the mean, D1 – D7 indicate different points and their distance from the mean, and the red line indicates the standard deviation. The line above the mean shows a larger standard deviation (because the red line is a farther distance from the mean) and you can see that on both sides of the mean, D6, D7, and D2 are slightly outside the standard deviation. Those data points are worth a closer look.
Now let’s explore an example with salesperson calls, which has two numeric variables:

There’s a linear relationship between the number of sales calls per week and the total sales per month. We can ask, “How many calls do I have to make per week in order to bring in $5.5 million dollars?” I have to make two-and-a-half calls (see the red box in the graph). The correlation establishes the norm, while the predictive analytics – or the regression – helps establish finding anomalous data out in the real world.
On first glance, it’s very easy to see the outlier in the bottom right. How is this person making $13 million a month with one phone call per week? Maybe he’s a superstar, or maybe he’s taking kickbacks and not making any calls at all.
Now, let’s turn to classification and categorical variables:

On the right are the classes, dogs and cats, and each record has different variable values like hair length, number of ears, whether or not it has a tail, etc. – which end up being useless, because both classes have tails and two ears. Cats don’t have eyebrows, so that variable alone would probably be enough for me to make a prediction in this model.
Our predictive model learns based on this data. If we remove the animal type from our table, we can ask our model to make a prediction, which will provide you with the predictive accuracy (i.e. how accurate was your model at correctly predicting the animal class). This is, very simply, how machine learning works.
This is an example of how you can group words in documents, which allows you to apply patterns and determine what is and is not relevant:

This helps you explore the data and determine where to focus.
What is fraud?
So, what is fraud? Below are its different elements:
- A false representation of material fact (i.e. a fact that is important)
- Knowledge of falsity by defendant
- Intent to deceive
- Reasonable reliance by victim
- Loss suffered by victim
There’s criminal fraud, and then there’s civil fraud – which you can sue for, and is called “intentional misrepresentation.”
Now let’s go over the definition of a conspiracy, another area in which graphs are particularly useful:
- An agreement between two or more persons to commit at least one crime
- Knowing of at least one of its objects and intending to help
- At least one overt act in furtherance of the conspiracy (some jurisdictions)
Graphs are also helpful in conflict of interest cases, defined as:
- When the concerns or aims of two different parties are incompatible, or
- Being in a position to derive personal benefit from actions or decisions made in their official capacity
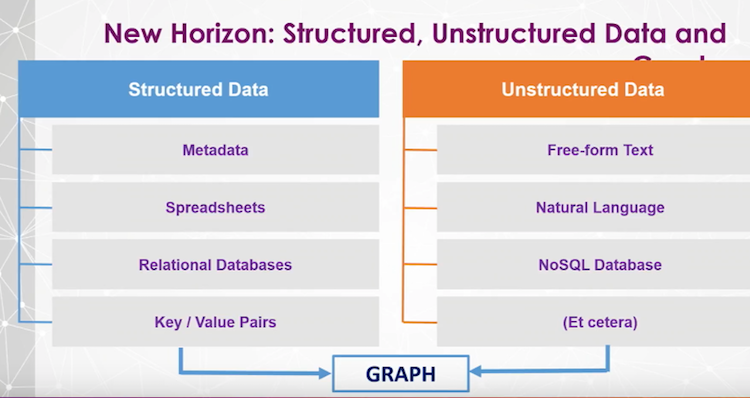
The new horizon: Building on the foundation
Let’s get into what I consider to be the Holy Grail: bringing structured and unstructured data together into a graph:
Remember, this is for an investigation, so I’m doing all the gumshoe stuff like interviewing people, as well as taking advantage of powerful high-tech tools.
Here’s the basic approach for bringing all of this data into our graph, which is most often being used in investigations and threat-detection systems:

Original files contain text, which we have to extract and put into a text repository like MongoDB or Cassandra. We retain all the original metadata, such as filename and date, in a text file repository, and use the data to create a search engine for information retrieval.
Here’s a deeper dive into this same system:
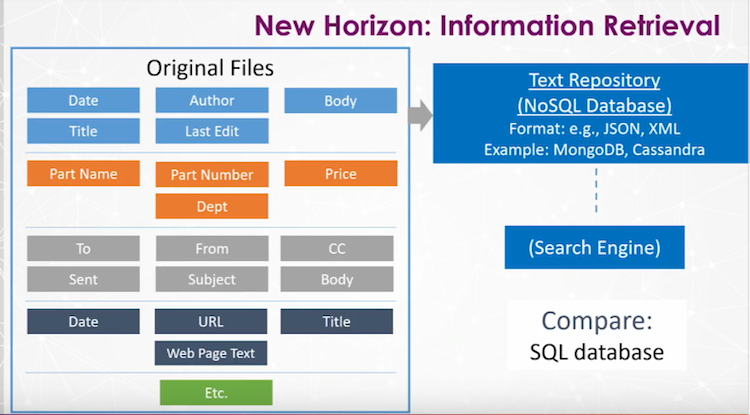
The first file (blue) is likely a Microsoft Office document, the second (orange) is some sort of inventory or financial record, the third one (grey) is an e-mail and the fourth (dark blue) is a website. This is all going into the text repository, and ultimately the search engine.
Information retrieval
If you were going through a book to look for something specific, would you start on page one and just skim each page until you found what you were looking for? No, you would go to the index, look up the term you’re searching for, and go directly to that page. There are things like stop words and noise terms, such as the word “the” and “too,” which are omitted because they don’t really provide any information – and storing them would make your index enormous.
You use tokenization to break things down into words or word combinations so that when you search, you’re searching on exact targets. With case conversion, you make all letters lowercase so that things aren’t omitted from your search due to capitalizations. With stemming and lemmatization, you’re reducing a word to its simplest form.
Consider the terms running, ran and run. All of these would be converted to run in the index, so if you search for one version of a word, all versions of that word would come back in your search. These transformations not only need to be made to the index, they also have to be made to queries before the search is processed.
This is what our data looks like once all these transformations are completed, which is displayed in a sparse matrix:
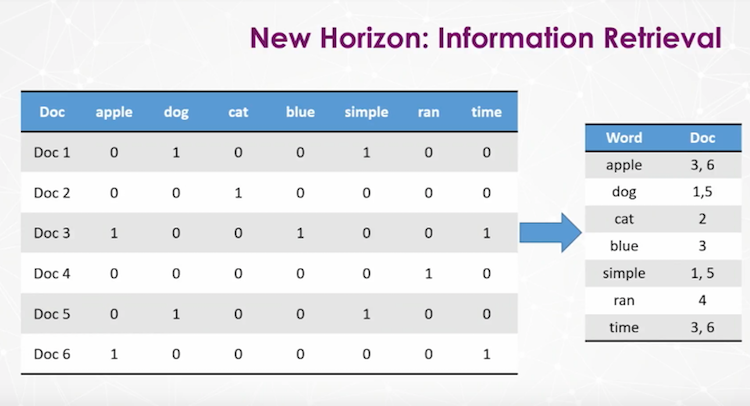
When you add a document, you also have to add a column for every word in that document – which very quickly becomes this ugly 4,000 column long, 10,000 row deep thing. Instead, we create an inverted index that includes the word followed by all the documents in which it’s found.
This represents an unsupervised machine learning approach to finding important words in a document collection. The theory is that if a word appears many times in a document, it’s important, but it appears many times across the document population and collection, it’s not important:

A word will then ultimately be given a TF-IDF score, which is used for research relevance ranking and for key-worded invocation. You then add the TF-IDF score, indicated in parentheticals, to the inverted index:

In this example, the word “apple” is in document three and has a TF-IDF score of four, whereas in document six it’s given a score of five, likely because it appears more often. So when you run a search for the word “apple”, the document that will come up first is the one with the higher TF-IDF score.
Information extraction
At a high level, so far we have created a search engine, run a search and pulled up a set of results.
In this next stage, we’re going to go into the text file repository, remove structured data from that side if we want it (which depends on the case) and then put the unstructured free-text into natural language processing:
When we take data out of natural language processing, out of the free-form text, we’re going to wind up with what could be name-value pairs, like a location.
The technology goes in, identifies a location, plucks it out, puts in in a column and structures it for you. When I’m doing investigation and I’ve got hundreds of thousands documents, I want to get right down to what really matters.
So here’s the way it works:

Most of this data is structured, but some – circled in red – is unstructured. Through a process called information extraction, we’re going to restructure our unstructured data using natural language processing.
To do this, we’ll start with raw text and perform sentence segmentation, tokenization, parts-of-speech tagging and entity detection to end up with entity extraction.
Here’s an example:
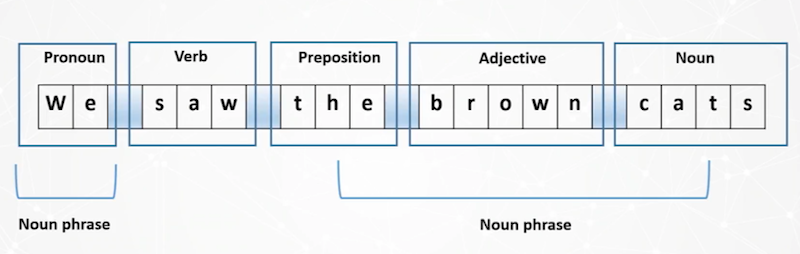
We’ve taken the sentence and broken it down, tokenized the phrase into individual words and applied parts-of-speech tagging. When you apply this to thousands and thousands of documents, we’re able to identify patterns through machine learning.
For example, if there are three nouns in a row, it’s likely to be a person:

We have a number of different data types, which are shown below – and which I believe represent all the types available in Python:

We have organizations, money, etc. So we can go into an email, find a dollar value, pluck it out, call it money and drop it into a spreadsheet. It’s pulling out all this data and letting us know the important who, what, when, where and why information – and it’s doing it automatically.
When we consider key phrase extraction, it’s really nothing more than TF-IDF. It extracts keywords and word combinations to help identify concepts, important terms, topics, code words and other “lingo,” and can also be used in document classification and clustering.
You can pull out categories, concepts, emotion, metadata, semantic roles, etc. – and you can use these tools to do all sorts of other cool stuff, like segment analysis.
And now: Graphs!
This finally brings us to putting all of this data into a graph database, which can help uncover things like voter fraud through the identification of multiple registrations at a single address; establish conspiracies by uncovering links between individuals; and explore conflict of interest cases by uncovering relevant hidden connections between different people, organizations, etc.
Graph technology also uncovers patterns in transactional data and frequently co-occurring items, as well as sequence mining, which considers the order of relationships. Examples include financial transactions, shipping fraud, web server activity and overseas scams.
I was involved in a case that involved shipping fraud. We were exploring the typical routes, which would take a certain amount of time to travel and which involved stops at certain gas stations along the way. We came across someone who was standing out from the typical pattern because of a-typical stops, and it turns out this person was unloading stolen merchandise.
At the end of the day, you’re taking this thing on the left and you’re converting it to context. What are the common patterns? How do people sequence through a site? This helps you find those patterns and tells you what’s normal or not.
Real-world examples
Let’s go through the following data, which I got from Bureau Van Dijk and rendered as a visualization through Polinode.
This graph shows the Trump Organization’s link to advisors and auditors, and we’ve pointed out some data groupings that really stand out and might represent a conflict-of-interest case:

Some additional real-world examples can be found through Citizenaudit.org, which is the only searchable source for IRS 990s, and uses Elastic and Neo4j; and the ICIJ and Panama papers data set, in which the ICIJ used Neo4j and Python to uncover fraud in a huge data set.
We also have the Trump BuzzFeed graph, which you can download and build yourself. The following demo will walk you through how we converted this dataset into a graph:
Conclusion
We’ve created what is essentially just a database. It doesn’t necessarily mean you’re going to find some smoking gun or a pattern. It’s simply a place to store all of your key information in one place so that you can learn from it.
With keywords and named entities, we’re able to identify exactly where we need to go, which helps provide a more efficient assessment of a case. Nodes can include a person’s age, income, address or any other information.
Newly found named entities and keywords can be run through a search engine to further expand the scope of a case, and queries of a graph database can create subgraphcs for visualization that proves helpful with fraud, conspiracy and conflict of interest research. All of these exploratory efforts can be used to inform predictive, production-grade analytics.
And finally, below is something the Neo4j team gave to me, which shows that if we do an investigation and we establish certain patterns, we can use those findings in a predictive model with Neo4j:

Share Article


Explore
Related Articles
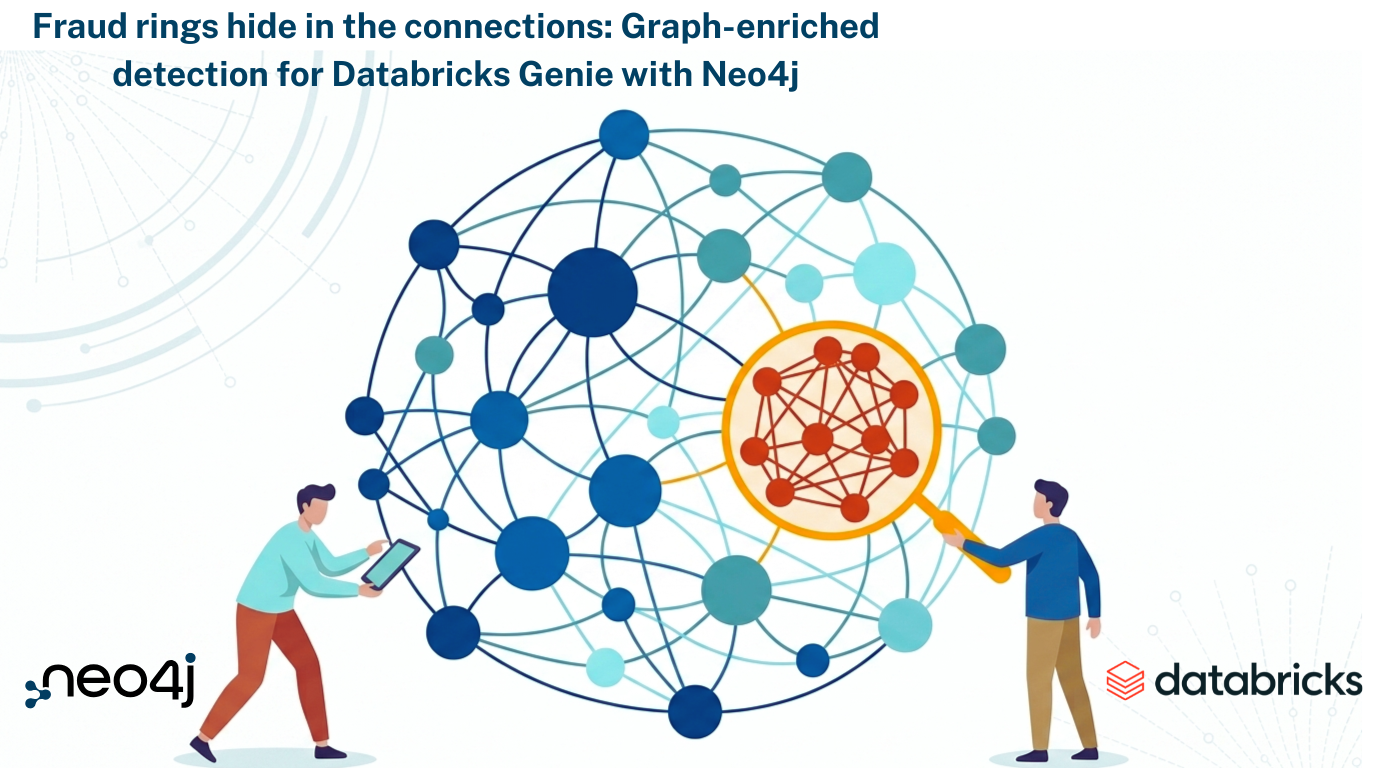
Fraud rings hide in the connections: Graph-Enriched Detection for Databricks Genie with Neo4j

SumoDB in Neo4j: Chaining Multiple Graph Algorithms in Snowflake — Part 3

APRA just put the financial sector on notice over AI. Government agencies need to take notes.


