
Leveraging Graphs for GDPR at Convergys

Vice President of Application Development and Technical Solutions, Convergys
14 min read
Editor’s Note: This presentation was given by Lloyd Byrd at GraphConnect New York City in September 2018.
Presentation Summary
Llyod Byrd is the Vice President of Application Development and Technical Solutions at Convergys. At Convergys, Byrd is responsible for the company’s application set. He is in charge of contact centers, corporate support systems and technical solutions.
In 2017, Convergys was faced with a new directive. This was going to require a new way of thinking in order to satisfy new directives concerning GDPR and specifically EU GDPR.
They started looking across their application set. At the time they had 120 applications that required immediate attention.
In addition to that, they had internal collaboration and storage tools to look at such as email systems.
After that, there were operational parameters that started to emerge concerning 106 customers across the EMEA footprint.
Byrd began looking at all of the lines of business in front of him. That number was close to 500 unique pieces of business with customers across 32 languages, 15 countries, 43 sites, and 19,000 employees.He realized that all of these pieces of data could be connected with graph technology. This was his beginning state.
At this point, Byrd and his team started to build a graph. They knew it had to include GDPR, compliance, employees, applications, infrastructure and stuff from active directory. This brought Convergys to GraphConnect 2017 where they came up with better integration layers and connectors.
During this time, Convergys underwent an acquisition. Now they were with Synnex corporation and part of Concentrix. This brought 120,000 employees to 220,000 employees. All of their data points effectively doubled in terms of scope. This brought new areas to study.
With graph, Concentrix learned they could study operational results. They could narrow tardiness trends down to specific supervisors, clients and regions.
They also found they could drive robotics process automation improvements in a clients operations using graph.
Log analysis is another opportunity area that lends itself to being better understood through graph.
Many of these topics are intertwined and connected amongst each other. Byrd feels as though Concentrix is just scratching the surface among this interesting graph-fueled journey that originally launched trying to solve GDPR.
Full Presentation
My name is LLoyd Byrd. I’m the Vice President of Application Development and Technical Solutions at Convergys.
My responsibilities are the whole application set for the company. I am in charge of those that are running contact centers, those are running our corporate support systems and those running our technical solutioning for our customers.
A Little About Convergys
Here’s a little information to put Convergys into context. We’re greater than 115,000 employees. We’re a worldwide company. We’re in customer care outsourcing. We’re the number two customer care outsourcing company in the world. We service greater than 50% of the Fortune 500 in our customer base. We speak 58 languages and process nearly three billion in revenue and eight billion contacts a year.
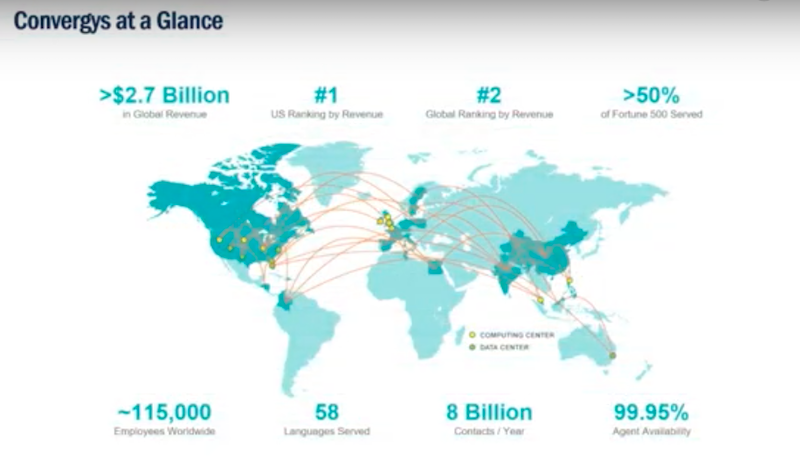
You already see how big numbers are coming into play. This is especially so around employees and customer interactions. That plays directly into our journey with GDPR.
When we say General Data Protection Regulation (GDPR) we’re really talking global GDPR. However, what really got us going- in terms of developing a strategy – was EU GDPR and having to solve for the EU directive.
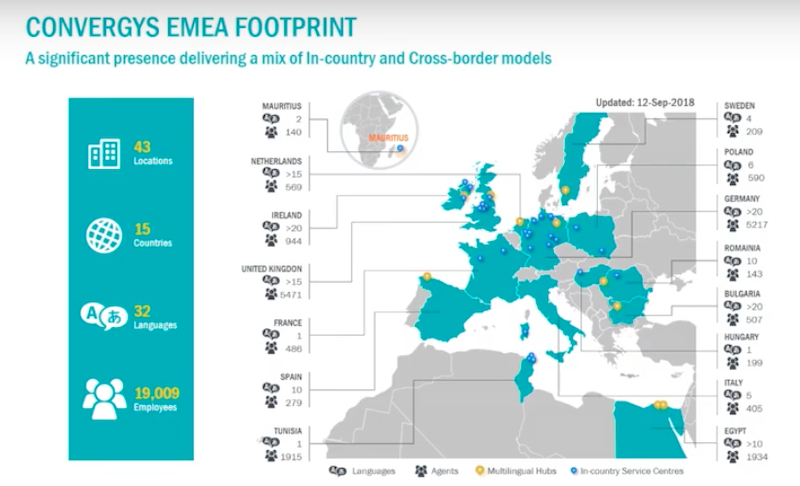
There were 43 locations, 15 countries, 32 languages and close to 20,000 employees across EMEA. Not all of those were in the EU, some of those in Tunisia, Cairo and in nearshore EMEA footprints. However, all were servicing EU customers in an EU customer base. With that, we had a large amount of considerations to figure out what to do.
The Need
In May of 2017, about a year before the directive was going to go in place, we started hunkering down to figure out what we were going to do and how we were going to do it in order to satisfy the directives that were coming out.
We started from a consultancy perspective and said, “What are all the things we need to look at when we’re thinking about GDPR.” Specifically, in this case EU GDPR. We came across eight possible solutions.
We knew we had to get with our compliance team and get policies and procedures lined up. We also knew that we were going to have to get a number of IT procedures and policies directly aligned, including some governance processes that we were working on with clients.
All of our systems have access control, they all have backup policies, backup retention definitions and so one. However, some of those didn’t match what were needed for EU GDPR and we had to make sure all of our processes and changes were lined up.
The tough problems came around encryption, around data at rest and around data masking. Then, probably the toughest issue, came around the question: What really is the key to it all? How are you actually going to do data subject rights request across all your systems?
We fundamentally came out of this period with a realization that we didn’t have any good ways to handle data subject requests. We’re still a little fuzzy about what we needed to do. And we didn’t have a real good way of discovering all of that information either. At that time, we started getting a little nervous.
In September of 2017, we’re sitting looking at the clock and the calendar and we’re eight months to go live. We had been thinking about some things and some ideas, including graph technology. We considered graph technology because the problem was starting to get very multidimensional, with a lot of data and various sources.
We started scoping.
Application Set
We started by looking across our application set. We had 120 applications that we really needed to look at – some of those were things we built, some were hybrid and some were third party applications. We needed to look at them all.
Internal Collaboration and Storage
We had a whole bunch of internal collaboration and storage things to look at that included email systems. These systems included email back to clients, internal email and SharePoint. We added SharePoint on-prem. We had shared drives. We had eight terabytes of SharePoint to look at in this particular context – that added more pieces to it. We had data centers, backup storage and infrastructure pieces that we had to look at.
Operational Parameters
Then, there were all of these operational parameters that started to emerge. There were 106 customers across that EMEA footprint. When you really look at lines of business, that number gets up closer to 500 unique pieces of business. This includes large pieces of business with customers, across 32 languages, 15 countries, 43 sites, and 19,000 employees. If you throw in some contracts and regulations then all this data starts to look like something that could be connected with graph technology.
We were thinking that some other method that we had traditionally used was going to make sense. We were trying to figure out all of the interconnectivity of this data. That was our aha moment. We said, “We’ve got to figure out a new way of thinking about this.” It took us four months to analyze this data, just to get a good handle on what some of these relationships were.

We looked at the market and we couldn’t really find anything that suited our specific needs.
We have a development organization. Even if we’re going to use new technology around graph technology, we were going to build it ourselves.
We started looking at building graph models.
We started looking at the tough stuff. The tough stuff was finding data that was non-structured. We got a pretty good handle on our applications, our data warehousing and our key systems. We use what’s called a global operating model, so we don’t have a lot of variation from region to region.
We have a good amount of consistency, but the unstructured data was throwing us through a loop in terms of how do we find customers or employees that might be in that unstructured data.
Data Subject Rights
Our next problem was this: What are we going to do with these data subject rights actions?
We had to do a lot more to do than just erase data. We need to be able to report on the data and disclose it to the relevant parties. In some cases the data does get erased, however, other bits of data may go in other directions.
Reporting and compliance was going to be a bit of a problem because we have to build some UI to capture these requests for data subject rights. We have to report back in the manner that the EU dictates. We didn’t have any of that, we were going to have to build that. It was something that was looming in the back of our minds.
Then there was all these apps. We were going to have to change all those apps and there’s one problem: These apps were all built to put data in records at a time. None of these apps were built to take data out records at a time or manipulate individual records.
Here we’ve got the issue of finding the solution and we’ve got the issue of what to do on the back end to try to deal with.
Beginning State
Our beginning state was a lot of these systems.

They are connected very well, especially to data warehouse structures, key systems and so forth. Most of the interfaces were built point-to-point which was making our challenge just a bit more difficult. As we were going there was some data replication that was happening across some of the systems that we had to account for and figure out what to do about it.
This was going to be expensive. We actually went through an estimation effort of what it would take to make changes to all these systems. The number was much too big.
We knew we had an end-state desire.
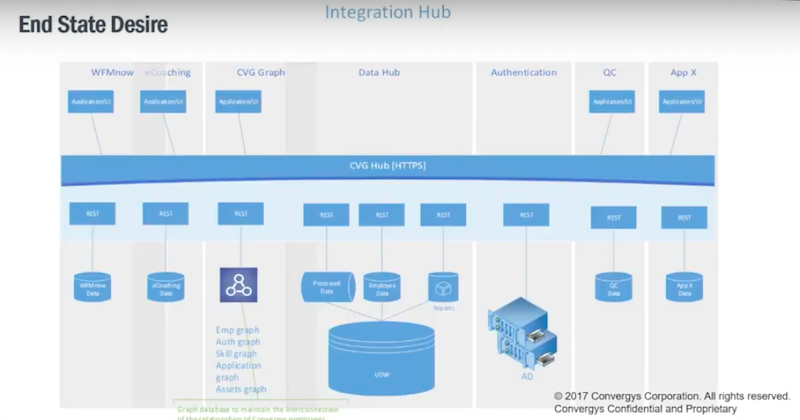
You see graph in this image above. That was in our end-state design structure along with some better capability and making changes to these systems. We had a lot of work ahead of us in order to figure out how to get there.
We started to build a graph.

If we’re going to do GDPR, we’ve got to have compliance, employees, applications, infrastructure and stuff from active directory. We started to build and we started the modeling process for it.
GraphConnect
That brings us to this GraphConnect 2017. We had been really thinking about how to use graph in this context. We were also thinking about ID management and some other areas, but we hadn’t pulled the trigger yet.
At GraphConnect, we came up with better integration layers with connectors.
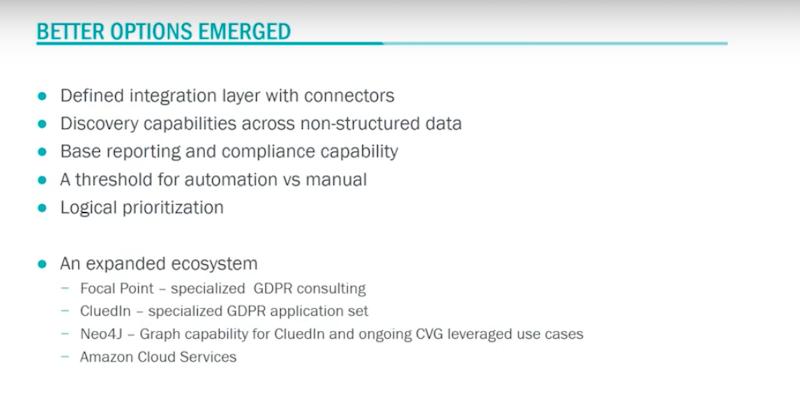
There are better discovery capabilities out there. We looked at base reporting, looking at automation versus manual and trying to define some sort of threshold and some prioritization. What we found was there is an ecosystem around graphs and started to tap into it. With that, we started working with Focal Point, which helped us refine what we needed to do and what we didn’t need to do.
Next, we met a company called CluedIn. Tim Ward is the founder of CluedIn which is out of Denmark. They use graph technology and have been doing a lot of work around data and data management. They were much further along in the context of solving EU GDPR problems and they had already solved a lot of our problems that would help us move along a lot faster.
We decided to partner with CluedIn and with Neo4j, of course. We’re running this on Amazon Cloud Services so we could start it up fast. In a matter of months all of that structure was done, settled, in place and we’re up and running on a project. We finally had a target and an approach to get there.
Implementations

Reza Conn is our chief enterprise architect and he built most of our technology. We worked with CluedIn, with Neo4j and Amazon to create an environment where we could have connectors into our application set. It was important to have these connectors in order to avoid the need to write code into every application. We used the enterprise service bus concept to create a solution that was as unique as EU GDPR.
A lot of ingestion occurs when you look across the SharePoint sites. We built the connector with the most critical apps. We gathered the apps that we felt had the most data associated with it was compliance.
We ranked every app from the 120 into three or four tiers. We implemented a certain set of the tiers and then left the rest manual and decided to come back to them later.
We decided to look at building connectors for those and some are just not worth it. The amount of data that’s in those applications would be so small it’s not worth the overhead of building the connector. If we get a small application, then we will deal with them manually. However, for the most part, everything ran this way.
Building for GDPR Global
From a visionary perspective, we wanted to not think of EU GDPR, we wanted to think of GDPR global.
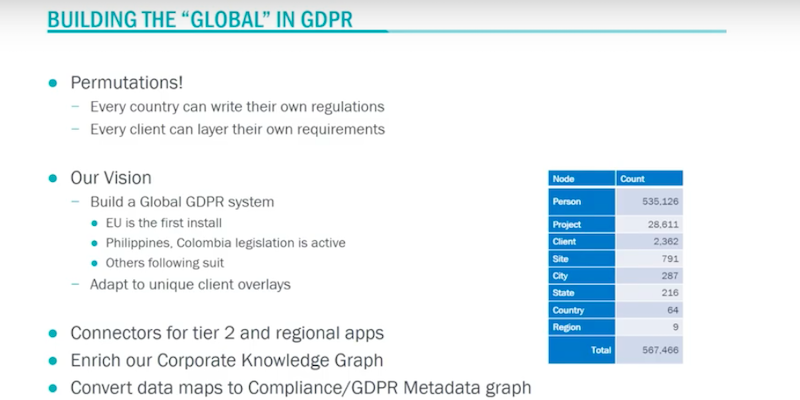
The Philippines has already a GDPR regulation, it’s not quite as stiff as what the EU is in terms of a penalty perspective. Colombia has issued GDPR regulation. We see more and more countries are probably going to be adding these types of regulations. In theory, every country can write their own laws surrounding GDPR.
We’ve had one major client, a top Fortune 50 client that said they’re going to write our own requirements and layer it over top of the GDPR requirements.
Now, not only do you have the possibility of every country writing regulation, you also have every client that can put their own spin on it from a contract perspective. That’s a lot permutations, when you start thinking about regulation and how to handle it.
Our vision was to solve for EU first, but we wanted to really think about this in terms of a global perspective and not just an EU perspective. The technology that we chose and the architecture that we chose fits well with that. We are able to expand out as the regulation continues to go and adapt for those client overlays.
As we’re doing that, we’re enriching our data. We’ll add more regional apps, we’ll add these tier two apps as we need to. As regulation continues, we want to take data maps, which are a regulatory piece of what you have to do to show that you’ve got all this stuff mapped. We’re going to convert that and put that into graph form. We’ve got a little bit more work to do.
We’ve been collecting a bunch of information along with GDPR at the same time. We’ve got 535,000 persons worth of information. We collect multiple years of data and that’s at the business level.
If you think about it, you are able to see, 567,000 worth of data points that we found with interesting relationships. We’re just getting started, because that doesn’t have any operation results tied to it. That’s just information at this point, which is pretty valuable.
Where are we at and what do we have on the horizon in addition to our GDPR approach?
Convergys is pending an acquisition, Synnex corporation and their version of us, customer care outsourcing company, Concentrix, is currently in the process of acquiring Convergys.
That means, 120,000 employees now becomes 220,000 employees. Every one of those data points that we talked about in terms of being able to graph and being able to look at relationships almost doubled in terms of scope. The opportunities are plentiful for us, just looking at integration opportunities in other areas where we leverage from an integration perspective. On our own and combined with Concentrix we’ve been looking at a lot at data and how to drive operational improvement and efficiency. We look at the data we’ve already been collecting in this knowledge graph and we want to start adding more operational results to it.
Operational Results
Let’s say we have a problem with tardiness in a region of the world. We are able to associate tardiness results to people, supervisors, clients, sites, regions or management. We could see operating results for a specific client. What are the overall trends for that client in terms of tardiness, et cetera, and be able to merge that operational data to drive some operational analytics.
That could also be performance-based operational result. We’re looking to take and expand these data sources that we have in order to drive more operational analytics.
Robotics Process Automation
We do a lot of robotics process automation (RPA) work. We’re trying to drive RPA improvements in a client’s operations. A lot of that discovery work associated with RPA is manual. It’s based upon knowledge that particular operations people have or that IT analysts are able to see.
What we want to get is more and more of this operational data to where we have points to go in and look at and say, “These are areas where we should look at for RPA.” We also should have more of that pre-discovery work automated. That’s another area for discovery for us.
Log Analysis
We’ve got tons of log analysis that we’re getting very limited to no value out of. That’s another opportunity area.
Other Opportunity Areas
We’re doing work around Smart Help and making good automated decisions off of chat, natural language, machine learning, proof of concept activities and so on.
We are looking at biometrics, especially facial biometrics and security solutions.
We’re seeing some cases with 10x improvement over previous models with large data loading. That’s an area where we think we can get real good value. We want to look at log analysis and improving our knowledge graph.
One area where the knowledge graph is an interesting use case is, what do we know about our clients?
We’ve got all of these data points around the company, especially a large customer that’s operating on a global basis and so forth. The way we actually get knowledge about our clients is pretty archaic when you think about it.
We have a SharePoint site that has all these different data elements about a client. If we get a new one we add another column in the SharePoint site. We use salesforce.com, which is interesting, but not super great in terms of being able to make discovery off of information around clients. We think there’s a value of information floating around the company. We believe we could create some better leverage in terms of that information about clients. That’s another area, along with the knowledge graph concept, that we’re looking at to improve.
Picture-wise, we think all of this could relate to each other.
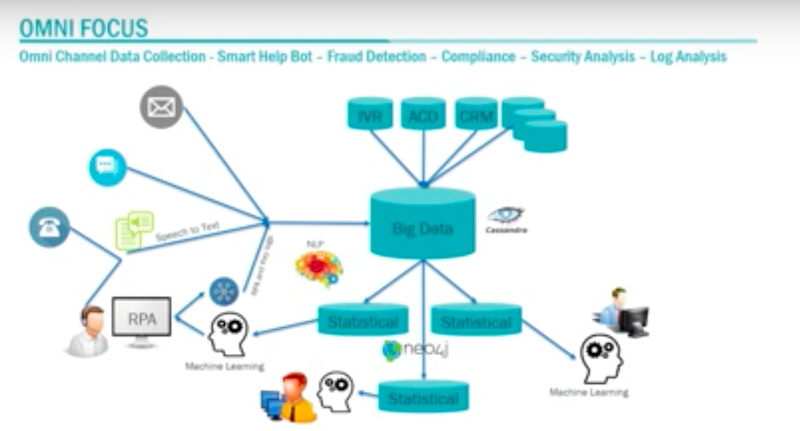
This is Reza’s favorite graph. We could take the data, and we have a lot of data within the company. We have many ideas concerning how we could do statistical analysis and reference. How could we tie that statistical analysis into machine learning. How could we tie that machine learning into RPA. How does that RPA tie back in to omni-type solutions that help benefit our customers or our internal operations.
We’re just getting started, but it’s an interesting journey that we’ve went though at this point led by trying to figure out how to solve GDPR.
Share Article


Explore
Related Articles


Top 10 Graph Database Use Cases (With Real-World Case Studies)

15 Best Graph Visualization Tools for Your Neo4j Graph Database

