
#GraphCast: Graphs in Life Sciences – The Cure for Connecting Complex Data

Content & Media Associate
1 min read
Welcome to this week’s #GraphCast – our series featuring what you might have missed in Neo4j media from the past fortnight.
Last time, our Staff Writer, Zaw Win Htet, featured an exposé on how the ICIJ used the power of graph technology to help map out the FinCEN files, which revealed how banks have been moving dirty money through the global economy.
This week, I’ve chosen to highlight a particularly pertinent talk, “Graphs in Life Sciences – The Cure for Connecting Complex Data,” part of which was given by Neo4j’s very own Rik van Bruggen.
This video takes us through graph databases and a few of their real-world success stories. Especially in a COVID-19 world, life sciences use cases have been increasingly prevalent in the biotechnology and pharmaceutical industries.
More broadly, the topics discussed in this webinar discuss areas in which users can apply graph data models to real business applications. Give it a watch!
Catch all our videos when you subscribe to the Neo4j YouTube channel, updated weekly with tons of graph tech goods.
Share Article


Explore
Related Articles

What Is Data Lineage? Tracking Data Through Enterprise Systems
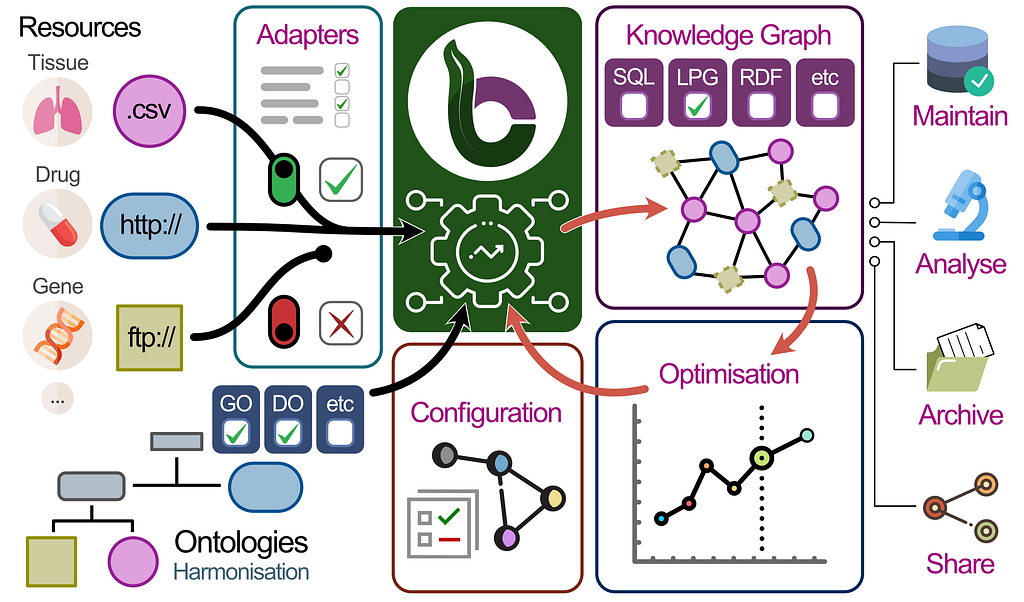
BioCypher: Unifying Framework for Biomedical Knowledge Graphs
Graph Data Science for Drug Discovery: The 5-Minute Interview With Ufuk Kirik


Graphs for Information Services: The 5-Minute Interview With Cyndi Streun
