
Maximizing the Value of Your Data with the Neo4j Graph Data Platform

Vice President, APAC Marketing
8 min read

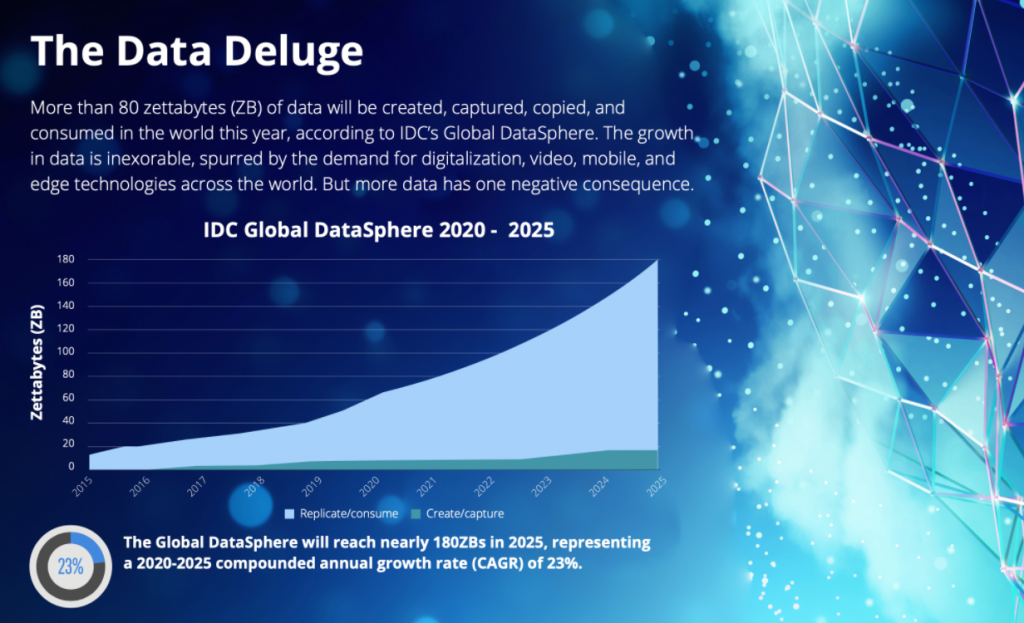
More than 80 zettabytes (ZB) of data will be created, captured, copied, and consumed in the world this year, according to IDC’s Global DataSphere. The growth in data is inexorable, spurred by the demand for digitalization, video, mobile, and edge technologies across the world. But more data has one negative consequence.
Extracting Value from Data Is More Difficult
Our attention filters data in the context of our knowledge
IDC Prediction: By 2021, organizations unable to bridge growing data, analysis, and decision silos will experience a doubling of their attention poverty rate, leading to an inability to separate signal from noise.
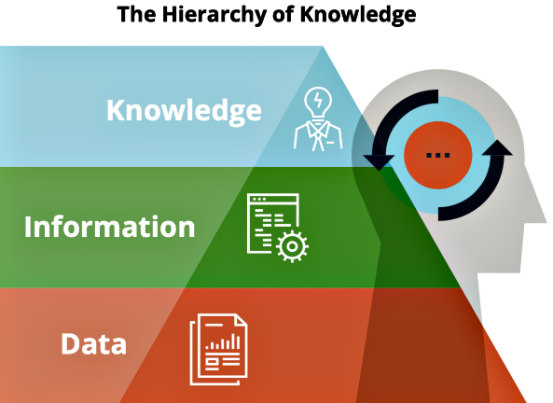
Standalone data has little value. To become useful information for a decision maker, data requires context and relevance.
Context describes the relationship of one piece of data to other pieces of data. The datum 1.7 means nothing without a context (say the average temperature increase in degree Celsius on a particular planet’s surface over the century). But context does not necessarily imply relevance – the usefulness of a piece of data to making a particular decision. That the planet concerned is Earth makes the data into information relevant for human beings.
Information is relevant data in the context that informs one’s decision or a situation one seeks to understand. Information helps build knowledge – verifiably true beliefs about the world. Such knowledge about causes and outcomes helps decision makers change the world and create value.
This conversion of data into information, knowledge, and value does not occur without effort by the decision maker – it requires attention and prior knowledge to make it happen. But the data deluge makes it increasingly difficult to understand the context of relevant data to create value.
A data-rich but context-poor world inevitably creates a poverty of attention for individuals and organizations. Attention poverty for an organization has major adverse impacts, leading to a sense of powerlessness and an inability to separate signal from noise.
How You Store Your Data Matters
Digital enterprises must transform data into actionable business insights to create value.
Clearly, data has potential value, and some companies extract more value than others from the data that they have. Many factors drive the efficient and effective conversion of data into information, knowledge, and value – for example, data-driven leadership, the knowledge and skills of a company’s employees, business processes, and the culture of the organization. But another important driver of the data-to-insights process is the technology used to store data. Extracting value from data depends on the way it is stored, the ease of access to it, and the extent to which we can relate that data to other contextual pieces of relevant data, information, and knowledge within the organization.
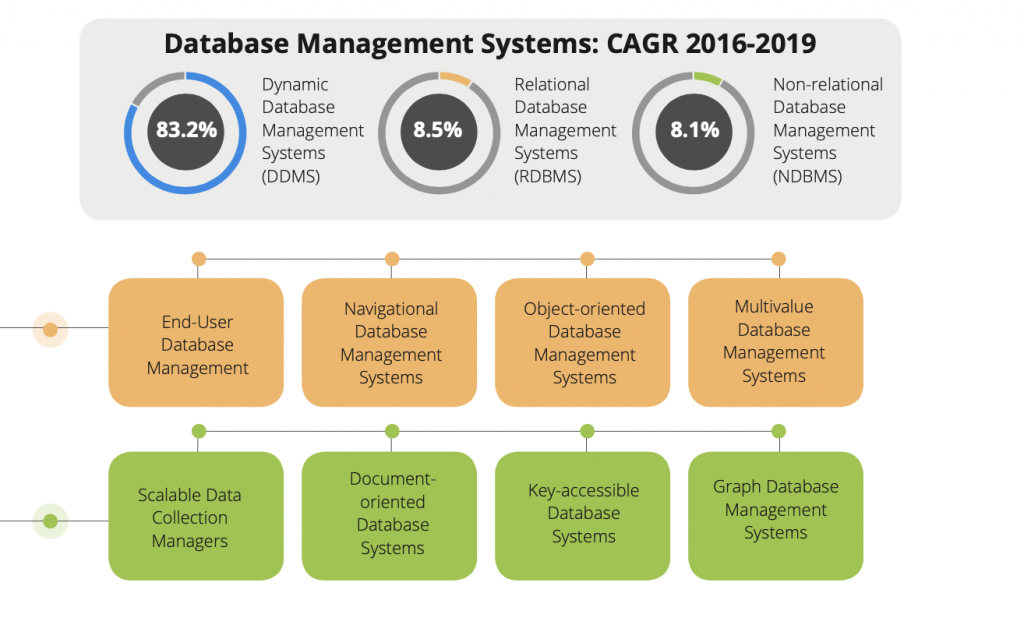
There are three common types of database management systems:
Relational database management systems (RDBMS) store data in tables. These are popular when the relationships between data are stable and can be captured in high-level table definitions. Relational databases can operate on a huge number of records quickly and tend to use less storage space. But they are not very flexible when dealing with more dynamic data, whose context may change over time.
Non-relational database management systems (NDBMS) offer a variety of alternative non-tabular approaches to organize, manage, store, and retrieve data. Traditionally, NDBMS are optimized for particular data types and are typically legacy systems not designed for newer, more dynamic workloads.
Dynamic data management systems (DDMS) can be more agile and efficient than RDBMS and have gained traction recently, growing at 83.2% CAGR from 2016 to 2019 as advancements have brought it closer to overcoming potential problems. One such dynamic database management system is a graph database. As the demand for graph-powered analytical and artificial intelligence (AI) tools increases, so too has the demand for graph databases and graph database platforms.

Drivers for the Adoption of Graph Data Platforms
What benefits do graphs bring to enterprises?
Revealing hidden structures
Graphs reveal the embedded contextual structure in data, where that data is unknown, without requiring extensive data preparation or much prior knowledge of how the data is organized.
Greater efficiency
In some cases, graph database management systems can be faster and more effective than traditional RDBMS, as they can analyze patterns and relationships quickly. Graph databases also take advantage of the fetch-execute cycle to allow them to execute their queries quicker.
Wide-ranging capabilities
Graphs can be applied to a wide variety of problems and use cases. These include:
- Discovering patterns of relationships among people, places, or things
- Mapping or charting the structural or spatial relationship among things or locations
- Capturing semantic structures from human language for the systematic understanding of content
- Genealogy-based, spatial-based, and law-enforcement/intelligence service–based “known associates” analysis
- Pharmacological research, epidemiology, and utility network analysis
Leveraging AI tools
Graphs are likely to play a key role in AI in the future. Because actions and consequences in a complex system generally result in changes to data relationship patterns, graph databases are helping drive innovations in machine learning (ML) and other AI-related operations.
Graph Use Cases – Providing Context for AI
Graph technology and AI/ML have important synergies
Top 10 AI Use Cases in APEJ 2020 *1
AI tools that can be graph-powered make up the majority of the top 10 AI use cases today.
- Automated customer service agents
- Automated threat intelligence and prevention systems
- Quality management investigation and recommendation systems
- Digital assistants
- Fraud analysis and investigation
- Smart business innovation and automation
- Sales process recommendation and automation
- Diagnosis and treatment systems
- Program advisors and recommendation systems
- Automated preventative maintenance
IDC PREDICTION: By 2022, at least 55% of A2000 companies will leverage AI tools such as NLP, MP, and DL business-wide to enable 55% of use cases across areas such as CX, security, facilities, and procurement. *2
*1 Source: IDC Spending Guide, 2021
*2 Source: IDC FutureScape: Worldwide Artificial Intelligence 2021 Predictions – APEJ Implications
Knowledge graphs that capture enterprise data as a graph can use AI/ML to “understand” the context of the data and therefore enable faster, more context-sensitive searches of the data.
Graph technology enables many important AI use cases that depend on the intricacies and rich interconnectedness of data captured in graph databases. Examples include using intelligent knowledge discovery tools, recommendation engines, and conversational AI, among others, to conduct contextual searches, make smarter recommendations, and offer richer insights. At the same time, AI/ML use cases create more data and more complex graphs, accelerating AI capabilities still further.
Therefore, IDC sees graph databases growing in lockstep with AI. The use of AI software is growing at a rapid CAGR of 34.1% from 2019 to 2024.

Painting the Bigger Picture
Graphs allow users to examine dynamic, complex or unusual relationships between data
This is particularly useful for use cases such as fraud detection, anti-money laundering, and supply chain visibility.
Detecting fraud and money laundering activities requires an understanding of the relationship between complex transactions, individuals, and companies across myriad jurisdictions. Graph databases allow users to visualize the intentionally convoluted relationships between entities, and provide more clues about fraud and money-laundering activities than do traditional approaches. Graphs also allow users to look at relationships on a broader scale. Once certain patterns are identified, graph analytic tools can help uncover similar types of money laundering or fraud. Armed with actual outcomes (fraud or not), investigators can feed this graph data into ML models to ensure more accurate predictions.
Case Study
Allianz used graph technologies to help spot fraudulent activities in its ecosystem. This was done through visually identifying illicit connections that fraudsters may attempt to conceal. With customer data stored in a graph database, Allianz was also better equipped to identify and uncover risks and overlapping coverages.
Supply chains are complex and inextricably linked.
Any issue with an entity would create a knock-on effect on other products. Graphs can provide individuals with the ability to visualize the supply chain from a macro perspective and identify the intricacies of the relationship between each part of the supply chain. Graph analytic tools enable enterprises to search through large amounts of data quickly to identify how changes in costs, demand, regulations, and supply can potentially affect them and take steps to mitigate these issues.
Boston Scientific has a complicated global supply chain that starts from raw materials to discrete products. This meant that when vetting products, the root cause of any defect could be hard to trace. By using graph technology, Boston Scientific was able to create data models that allow them to trace faulty components and connect them to the products.
Master Data Management
With ever more data being stored, there is a growing need to link data from a wide variety of sources. Graphs draw links between data in various silos, assisting enterprise data governance by creating consistency and lineage for their data.
Master data management has become increasingly important.
The COVID-19 pandemic has accelerated digital transformation and expanded the amount of data that organizations capture. Data is defined by IDC as the three D’s: distributed, diverse, and dynamic. Enterprises struggle with siloed data, and this is where master data management plays a crucial role.
Graphs can help master data management by building relationships between shared data objects such as customers, products, and partners. This means that data stored on multiple data sources and across silos can be connected so that employees are able to find data they need with a lot more ease.
As data grows, data governance becomes increasingly important. Graphs enable companies to track and visualize data lineages more effectively and allow them to discover issues with data quickly.
Case Study
Lockheed Martin Space: Lockheed Martin Space used a graph database to connect all its data silos. By storing the relationship between data and the various systems in a graph database, they were able to find answers to their questions a lot quicker. Lockheed Martin claim that they are now able to reveal connections they had not identified previously.
Airbnb: Airbnb’s global presence meant that managing data was a difficult task due to the sheer volume and complexity of the data collected. One of the common complaints they faced from their staff was the inability to find data needed for them to carry out their jobs. Airbnb mitigated this issue by tying together their data ecosystem using a graph database, which allowed employees to find the data they need easily.
UBS: After attempting a solution with a relational database, UBS switched to using graphs to evaluate data lineages and depict the results in a lineage diagram. This allowed them to gain better transparency into its own data.
Essential Guidance
IDC recommends the following to enterprises:
In today’s data rich world, more data does not equate to greater enterprise intelligence. Understand the core pathways to converting data into information, knowledge, and business value in your organization.
Identify how graph databases and platforms can help alleviate your challenges
Databases play an important role in facilitating an organization’s conversion of data into information, knowledge, and business value. Therefore, consider carefully the strengths and weaknesses of the different types of databases and how they support or hinder value creation out of your data. Understand the benefits graphs can offer and take advantage of these to improve your organization’s capacity to learn.
Choose the right graph database partner for your ecosystem
Capitalizing on graphs requires more than having a graph database. Look for vendors offering graph analytics platforms that can seamlessly integrate with your current ecosystem. Assess their overall platforms to ensure that their tools are in line with your organization’s current and future analytical and AI needs.
Share Article


Explore
Related Articles


How to Improve Multi-Hop Reasoning With Knowledge Graphs and LLMs


Beyond Vector Search: Unleashing the Power of GraphRAG for Smarter Recommendations
