Neo4j Is in Bloom Everywhere This Spring


4 min read
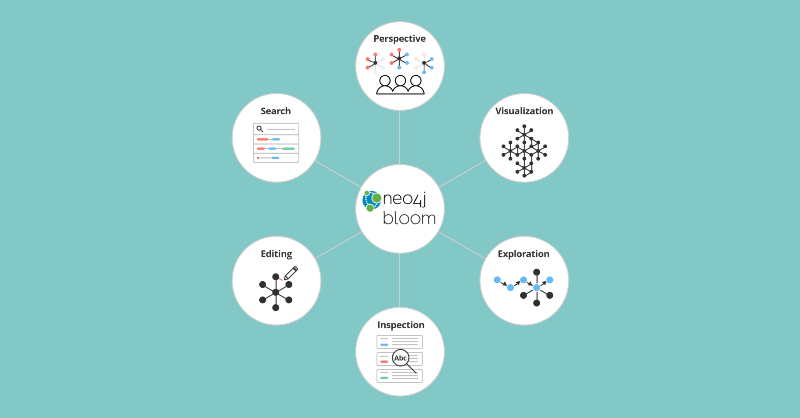
Two years ago, Neo4j Bloom™ was announced to the world. Today, I’m excited to announce that we’re bringing graph visualization and exploration to everyone using Neo4j – on any platform.
(Neo4j Bloom) -[:IS]→ (Everywhere)
Bloom in Neo4j 4.0
With the release of our next-gen database, Neo4j 4.0, Neo4j opened up new categories of uses such as sharding petabytes of data while unifying search and visualization that simultaneously respects granular security.
I am thrilled to say that the recently released Bloom 1.3 can now be used to explore connections in your business data in Neo4j 4.0. For example, with Bloom on 4.0, you can use more than one active database at the same time. This could be useful for exploring different datasets or visually investigating differences between different iterations on the same data.
Bloom Is Now Free in Desktop for Local Development
Just as exciting is that Bloom is now free for local development in Neo4j Desktop. Desktop has been a hit with Neo4j developers, garnering hundreds of thousands of downloads to date. Developers love the ability to set up databases locally in Desktop and prototype in a controlled environment on their machines.
Now, a hundred thousand developers will find they can use Bloom to visually explore their local datasets. Developers can now easily show their progress to peers, get feedback from an analyst or ask a business stakeholder to approve a project they were able to prototype end-to-end on their local machine.
Bloom in Graph Data Science
Earlier in April, we announced Bloom as a key component of the Neo4j for Graph Data Science™ framework. Data scientists across a wide-range of industries are using this new solution to run a multitude of graph algorithms and effectively answer questions about their data’s topology or add highly predictive features to their data.
Bloom helps data scientists visualize critical insights at different junctures in the data science workflow, both for validation and explainability.
// Watch a Bloom demo from the Neo4j Connections: Graph Data Science event.

The result of an item similarity graph algorithm visualized in Bloom to show item to item influence based on centrality characteristics.
Bloom in Neo4j AuraDB
In early May, Bloom will also be available in Neo4j Aura™, the world’s most flexible, reliable and developer-friendly graph database as a service. AuraDB is a great way to start development in Neo4j without managing operations. Bloom will be available in the same no-hardware-required, easy-to-deploy way as your Neo4j database.
So you see why we’re saying (Neo4j Bloom) -[:IS]→ (Everywhere). This is a great leap forward to make Neo4j developers more productive – wherever they are.
Bloom Enhancements for Visual Exploration and Productivity
On top of making Bloom more available, we’ve also recently added new capabilities to make developers more productive when visually exploring entities using Bloom.
Search
-
- Case insensitive matching of values helps the user find the entity of interest quickly. The full text index feature of Neo4j is employed to search in a case insensitive fashion.
- Search phrases in Bloom are used by developers to save frequently used Cypher queries that help end users search easily. Addition of data type definition to parameters used in these search phrases better defines how the end user should answer parameters in their queries.
Explore
-
- Selecting one or a group of nodes to expand is a great way to explore graph neighborhoods. For nodes with lots of relationships, Bloom now allows the user to be selective about which relationship types to expand, or which neighbor types to explore next, rendering the result more manageable and intelligible. For example, the Bloom screenshot shows selection of the transaction relationships to help us focus and reduce the noise of sifting through all possible relationships.
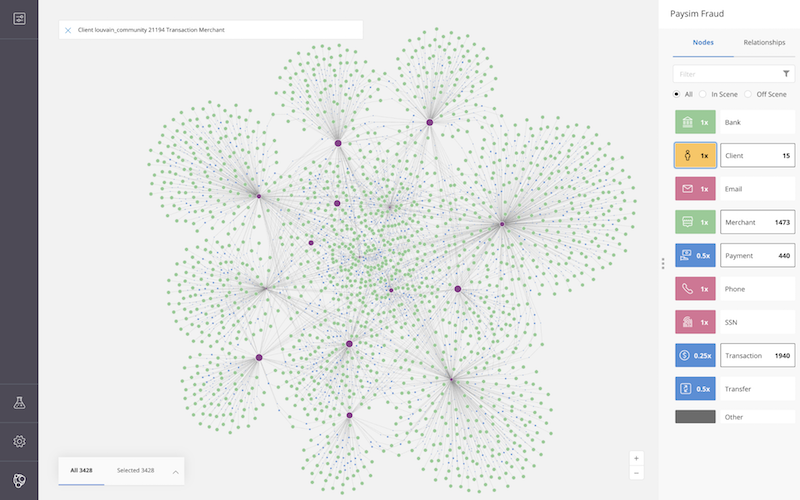
Exploring transaction relationships of members in an identified community of suspects to merchants they are transacting with.
Flexible Styling Choices
-
- Bloom Perspectives now allow specifying size and color styles for both nodes and relationships. Decide how big nodes and how thick relationships should be based on their relative importance in the scene, as shown in the Bloom screenshot below.
- Choose data-driven styling to drive size and color styles from the data contained in the graph and make visualizations respond more dynamically to the queries you run.

Visualization of fraud rings in Bloom using variable styling that brings out the important nodes and relationships to the forefront.
Results
-
- Export results of an analysis as a set of comma separated values for both nodes and relationships, so the data can be used for further analysis or used in another system.
// Read the Bloom documentation to learn more.
Empowering Developers Everywhere
With the broader availability of Neo4j Bloom, you can now take advantage of visual graph exploration throughout your Neo4j journey – from starter graphs on the Neo4j Desktop to sophisticated data science powered graphs, and from an operations-free setup in Neo4j AuraDB to your own environment running multiple databases in Neo4j.
We want to hear where you will take graph exploration from here. Stay tuned for more Neo4j Bloom updates and let us know how your graph exploration journey is going.
Share Article


Explore
Related Articles

A workbench for teams to query, explore, and visualize graph data
Bolster your cybersecurity by visualizing attack graphs with Neo4j & G.V()


15 best graph visualization tools for your Neo4j graph database
