
Neo4j + KeyLines: The Developer’s Route out of Dependency Hell [Community Post]

Consultant, GraphAware
7 min read
[As community content, this post reflects the views and opinions of the particular author and does not necessarily reflect the official stance of Neo4j.]
Most software developers will, at some point, find themselves in dependency hell. It’s a terrible place to be, a frustrating maze created by conflicting interdependencies between software components.
Most software projects build on top of other tools – re-using libraries or modules to save time and effort. As projects and teams grow, these dependencies can quickly become a dense forest of connections that is almost impossible to manage – as npm discovered earlier this year when the deletion of 14 lines of code broke thousands of projects.
Like any challenge involving connections, software dependencies is essentially a graph problem. During a recent internship at Cambridge Intelligence, I became interested in how graph visualization tools like KeyLines can help developers better understand their project’s dependencies.
Let’s take a look at the graph visualization application I built, and walk through some of the Neo4j and KeyLines functionality a developer can harness to better understand software dependency in their applications.
My Dataset
Using some clever npm commands I was able to create a JSON object describing the structure of create-react-app – a popular package widely used to create a starting app in the React JavaScript framework.
Then using Neo4j’s superb JavaScript driver I was able to write a parsing script, creating nodes and relationships in the database, focusing on these three relationship types that would be central to understanding my data:
(:Package)-[:DEPENDS_ON]->(:Package)
(:Package)-[:HAS_LICENSE]->(:License)
(:Package)-[:HAS_UPDATE]->(:Package)
This is an excerpt of the script showing the main loading Cypher query:
var session = driver.session();
session
    .run(`
        WITH {depArr} as list
        UNWIND list as item
        MERGE (p:Package {pid: item.pid })
        SET p.name = item.name,
            p.license = item.license,
            p.hasParent = item.hasParent
        WITH p AS dependency
        MATCH (parent:Package)
        WHERE parent.pid IN dependency.hasParent
        MERGE (dependency)<-[r:DEPENDS_ON]-(parent)
        `, { depArr })
This query creates all :Package nodes and their :DEPENDS_ON relationships. Note the power of the UNWIND Cypher keyword that allows us to create nodes from a list parameter. Subsequent queries can be run in new transactions by subscribing to the completed session event.
The script takes a few seconds to load, leaving us ready to visualize the network.
Building My Graph Visualization Application
In the interest of brevity, I won’t go into detail about how I built my graph visualization application with the KeyLines JavaScript toolkit, but you can find Neo4j demos on our SDK site or some step-by-step guides on our blog.
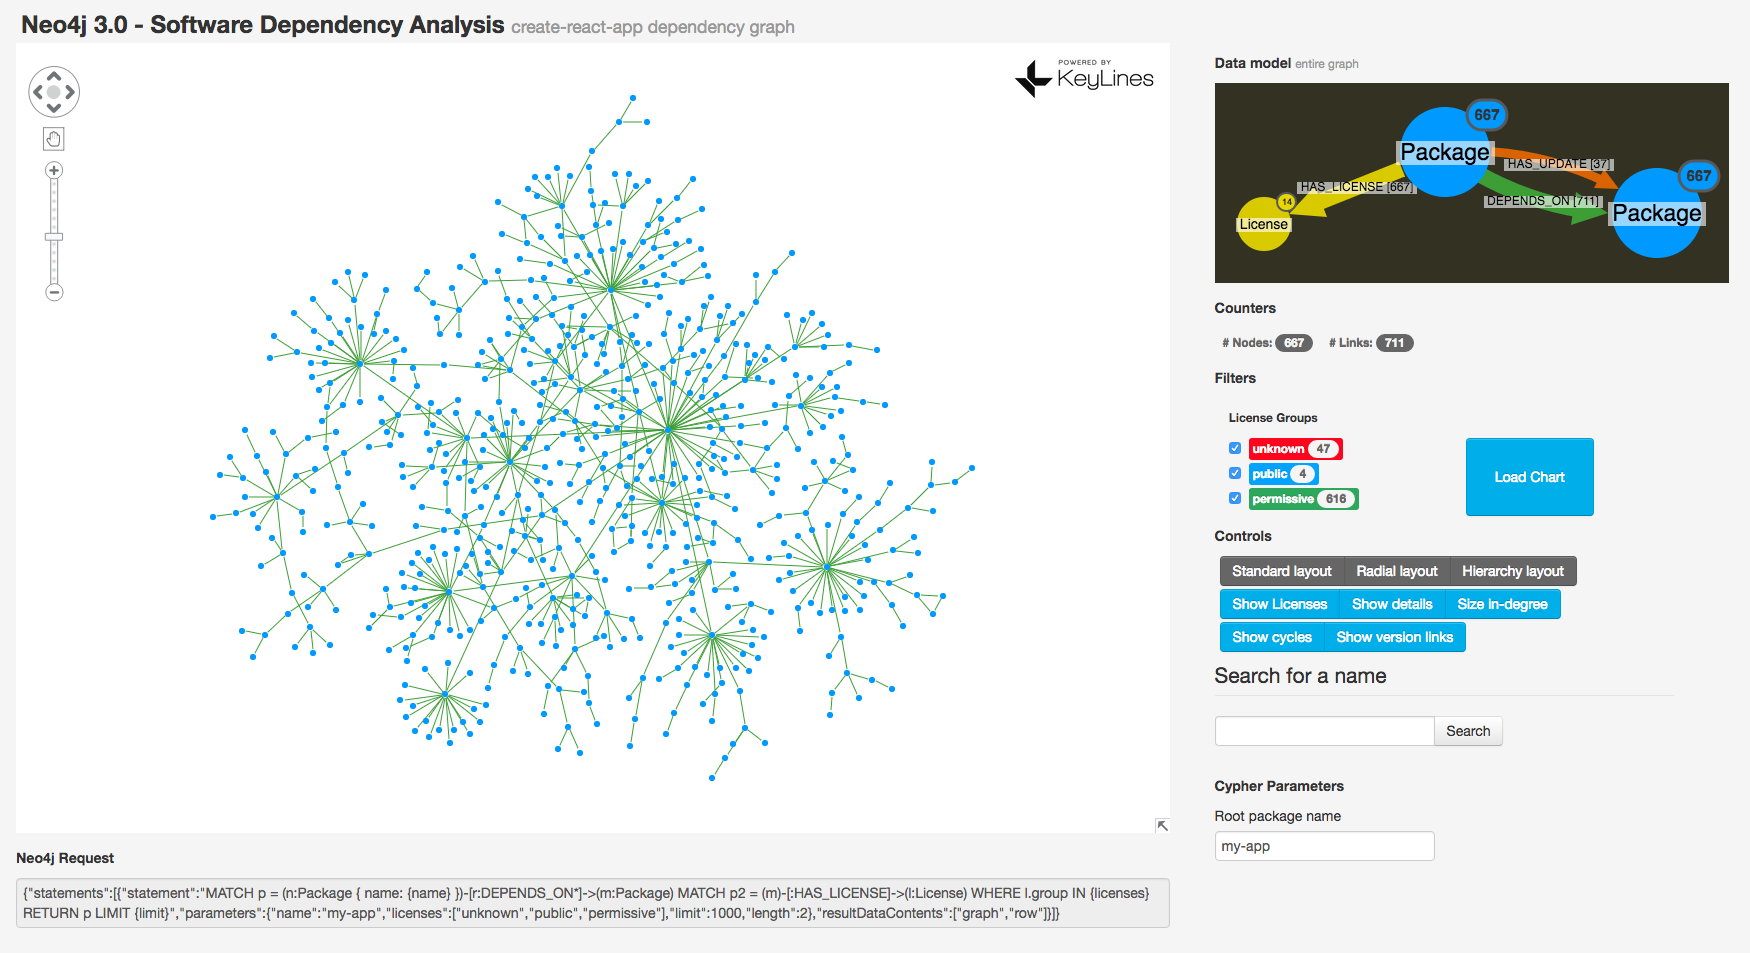
The end result was this:

I’ve included some neat KeyLines functionality, including multiple charts (one showing the main graph, another showing the graph data model) plus some layout options, a search box and, of course, a connection to my Neo4j graph database and a Cypher integration.
The Big Picture: Visualize the Entire Graph
Often, when working with a new graph dataset, the first thing that I want to see is the entire graph. It’s a good way to understand overall structure and the main patterns in the dataset. Happily KeyLines is easily capable of visualizing many tens of thousands of nodes at once.
There’s a few steps for calling all data and loading it into a chart:
- Raise a Cypher query (e.g., via a jQuery AJAX request) to the Neo4j server HTTP Rest API (or, if you prefer, use the aforementioned driver along with the Bolt protocol).
- Parse the Neo4j response to comply to the KeyLines object definition (where you define nodes and links with their visual properties).
- Run
chart.loadto load this data into the KeyLines component which will render it using HTML5 Canvas or WebGL renderers.
So, if we run the application with an initial “big picture” query MATCH (n:Package)-[r:DEPENDS_ON]->(m:Package) RETURN *, we see the following graph:
Already we can see how dense our network is. There are 667 nodes, tied together by 711 links. Some branches are 10 hops from root to tip! Some important nodes stand out as “star nodes,” like the central “react-scripts” node.
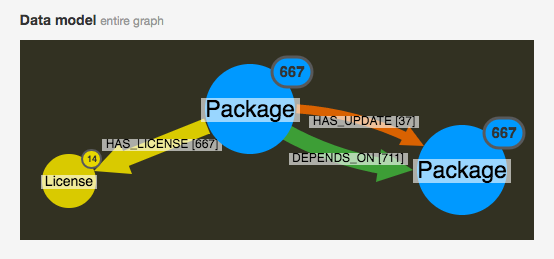
Before proceeding with visual improvements, let’s create a second component to display the graph model.
A Note on the Graph Model
My visual graph model is generated using the Neo4j APOC procedure apoc.meta.graph. The query returns a mini-graph where each :Label is represented as a node and each :REL_TYPE as a link.
apoc.meta.graph also returns a convenient count of all nodes for each :Label, that we can visually map to node size with KeyLines. I wrote my own query to count relationships for each :REL_TYPE, which I also tied to the same visual data model:
Understanding Structure: Finding Important Nodes
A quick way to understand graph structures is to use social network analysis (SNA) algorithms – measures to pinpoint important nodes in a network.
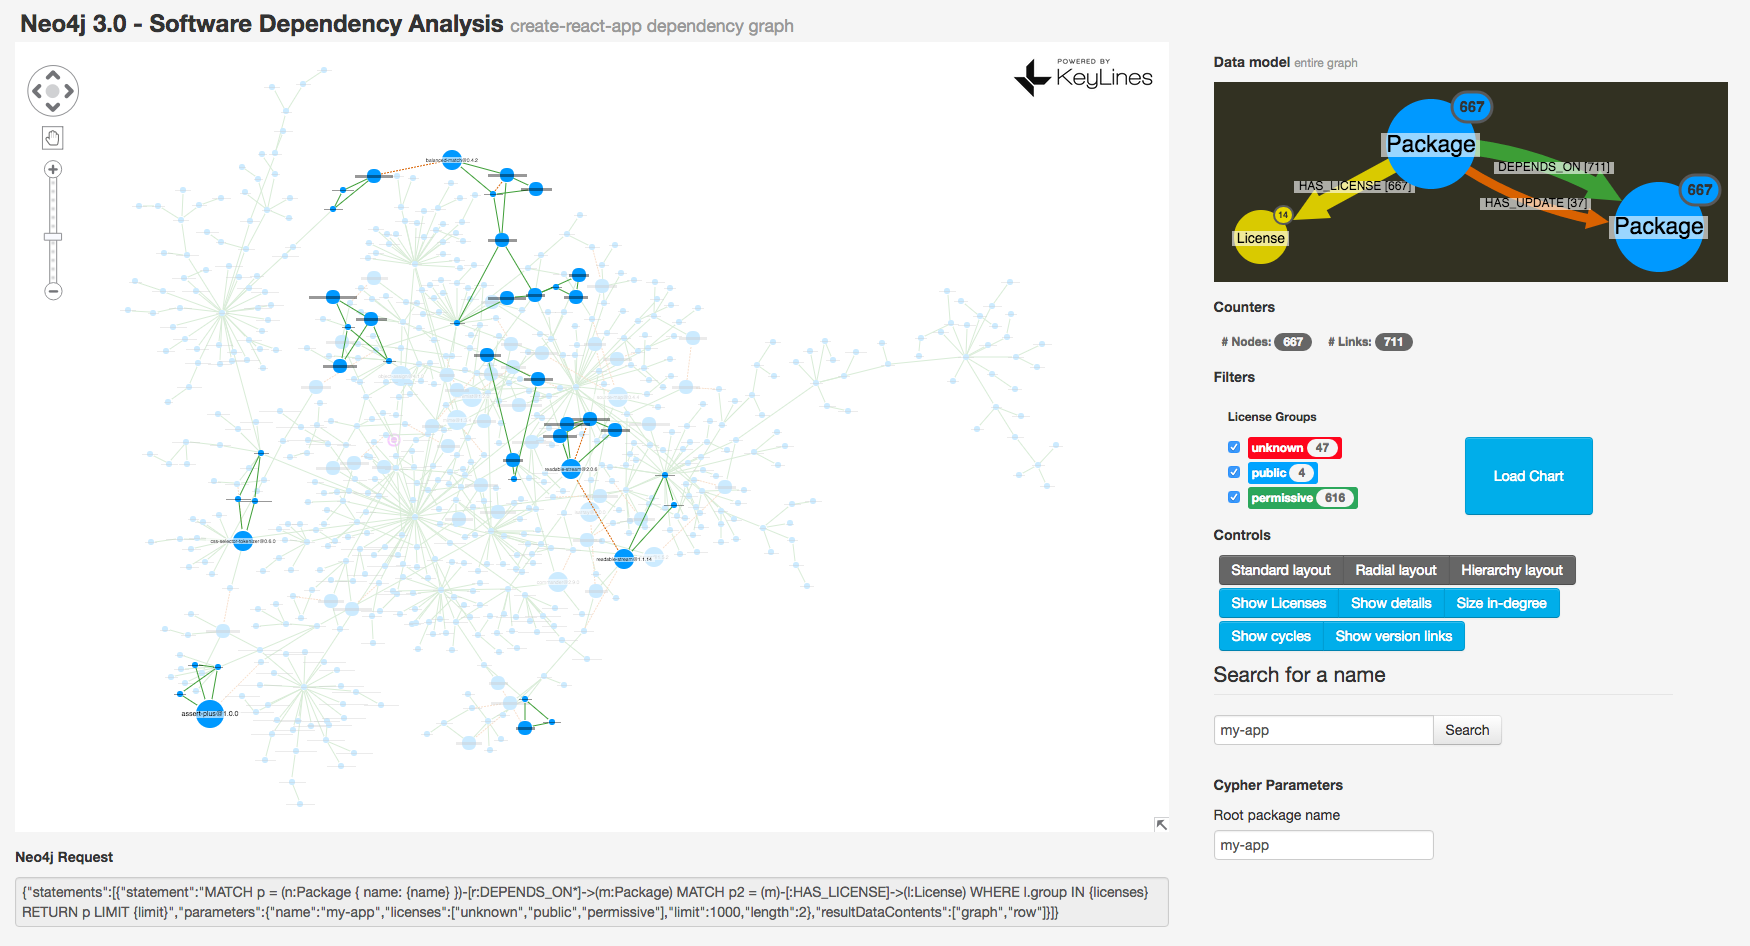
In-degree is a simple example of an SNA measure. It works by counting a node’s inbound links to make the most cited packages stand out. In-degree can be calculated either in Neo4j or in KeyLines. I chose the second option because it makes it easier to tie to visual properties, like node size:
var sizes = chart.graph().degrees({ direction: 'to' });
So nodes which are most depended upon will be bigger in our network.
Circular Dependencies
Another interesting thing to look for is dependency loops – where two nodes are dependent upon each other, or form a longer cycle with some intermediary node. Those cases can be tricky. Neo4j makes it easy for us to search for these:
function findCycles(length) {
    cypherQuery = `MATCH p=(n:Package)-[r:DEPENDS_ON*${length}]->(n)
        UNWIND r AS rel
        RETURN collect(DISTINCT id(n)) as nodeIds, collect(DISTINCT id(rel)) as linkIds`;
    ...
}
We now want to make these co-dependent nodes stand out in our network. To do this, we use the Cypher COLLECT() function to return arrays of ids and pass them to the KeyLines chart.foreground function which will make them visible.
In this graph, there are no circular dependencies of any length. But it is still interesting to check if there is any undirected cycle. Let’s see undirected four-length cycles (considering also version links):
There’s quite a few in there which can be worth of further investigation since they can present a sort of “anomaly” in such a tree, (e.g. involving multiple versions of a package).
License Compatibility
Another aspect of software dependency management that needs to be carefully managed is licensing. If your project uses packages with different licenses, you could find yourself in trouble.
Let’s take a look at the license compatibility in create-react-app.
Generate a Legend
My first step is to check which license types are in my dataset, and create a dynamic legend to help our users find patterns and filter. I do this with a mix of Cypher and some jQuery:
function createLicenseLegend() {
    cypherQuery = `
        MATCH p = (m:Package)-[r:HAS_LICENSE]->(l:License)
        WITH l.name AS license, count(m) AS count, l.group AS group
        ORDER BY group DESC, license, count DESC
        RETURN license, count, group`;

    neo4j.query(cypherQuery, params, 'row', function(err, rows) {
        $('#legend').empty();
        rows.forEach(function createDOMrow(row) {
            var color = getLicenseColor(row.license);
            var element = $(`<label class="legend"><span class="label"
                          style="background: ${color};">${row.license}
                          <span class="badge">${row.count}
                          </span></span></label>`);
            $('#legend').append(element);
        });

    });
};
For simplicity, I combined my license types into three groups: permissive, public and unknown.
Create Some Filters
Let’s create a filter with some Cypher magic, altering the WHERE clause of our query:
cypherQuery = `
    MATCH p = (n:Package)-[r:DEPENDS_ON]->(m:Package),
    p2 = (m)-[:HAS_LICENSE]->(l:License)
    WHERE l.group IN {licenses}
    RETURN p`;

params = { licenses: checkedLicenses };
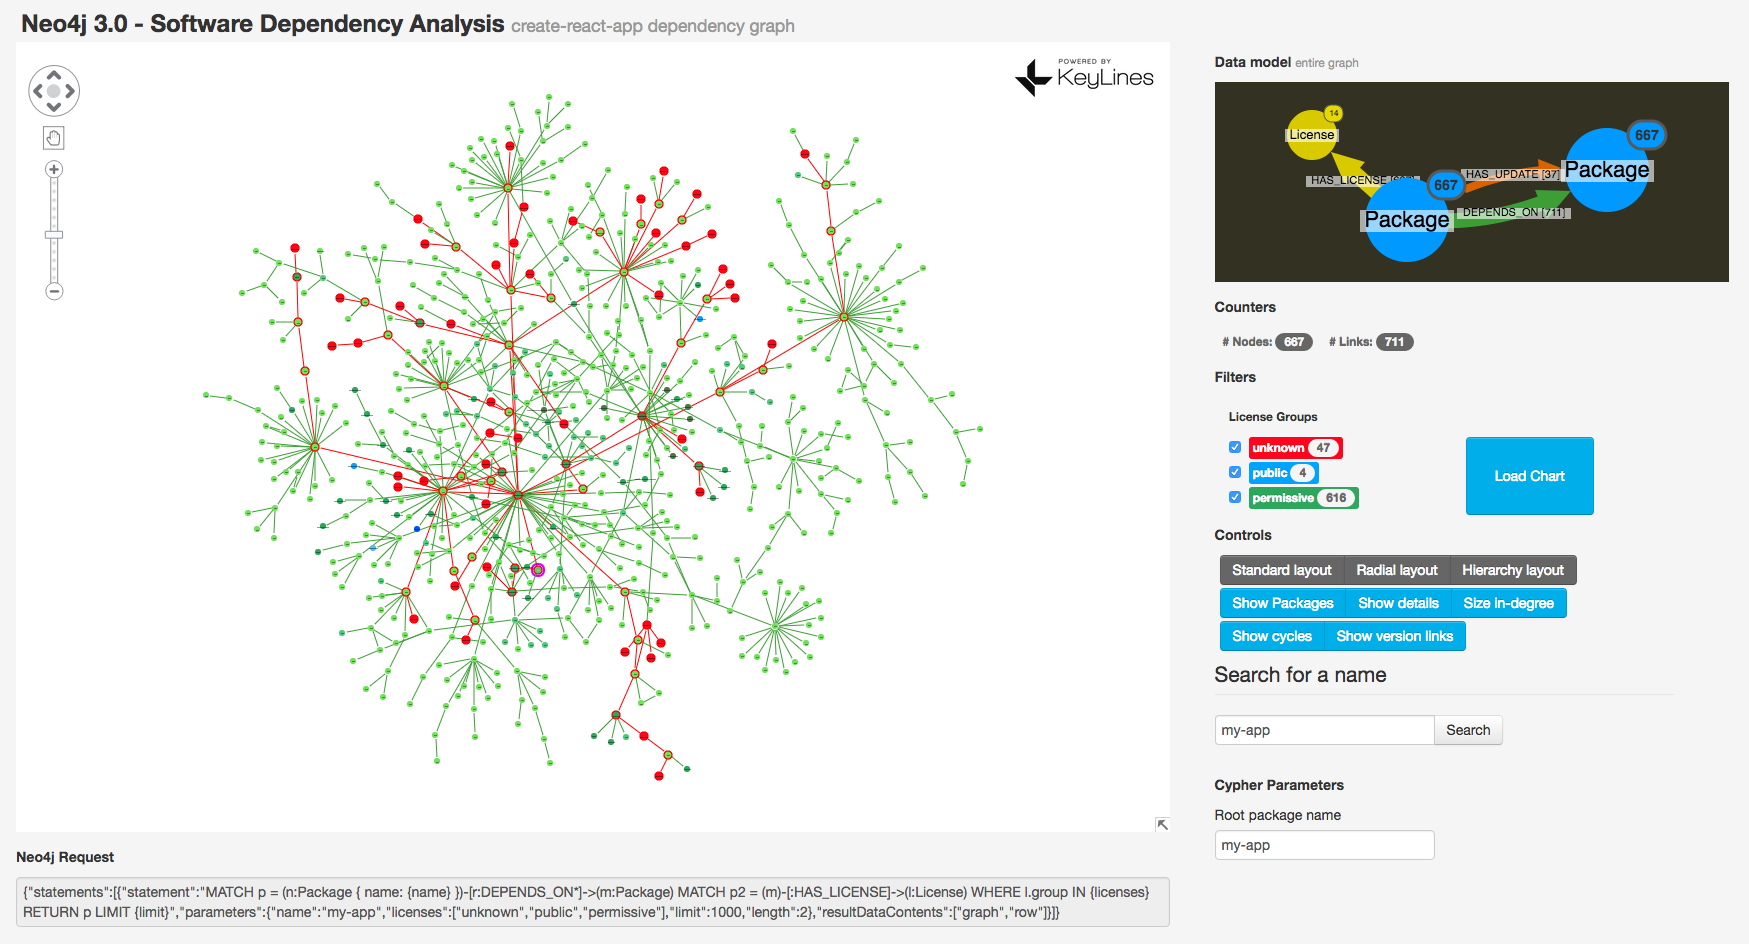
We can then pass our “checked” license list as a parameter and use the Cypher IN operator to filter nodes accordingly, and bind it to some buttons in our UI. The last step is to use KeyLines Glyphs to provide some additional license information:

Any conscientious developer would want to investigate packages with unspecified license. In my visualization, I’ve colored them red.
Following the Scarlet Threads with KeyLines Shortest Paths
KeyLines graph().shortestPaths is a perfect function for this! We can use it to highlight the route from our unknown license node to the root:
Evaluation of New Dependency Branches
The last thing I want to show is the evaluation of the dependency branch of a remote package before installing it. We can do this by running a recursive script, using npm view --json command from the server side and merge the stream of new items in the graph with KeyLines’ chart.merge function.
We can then tell KeyLines to apply a different style (in this case a dashed outline) to the freshly loaded items to distinguish them from our existing nodes:
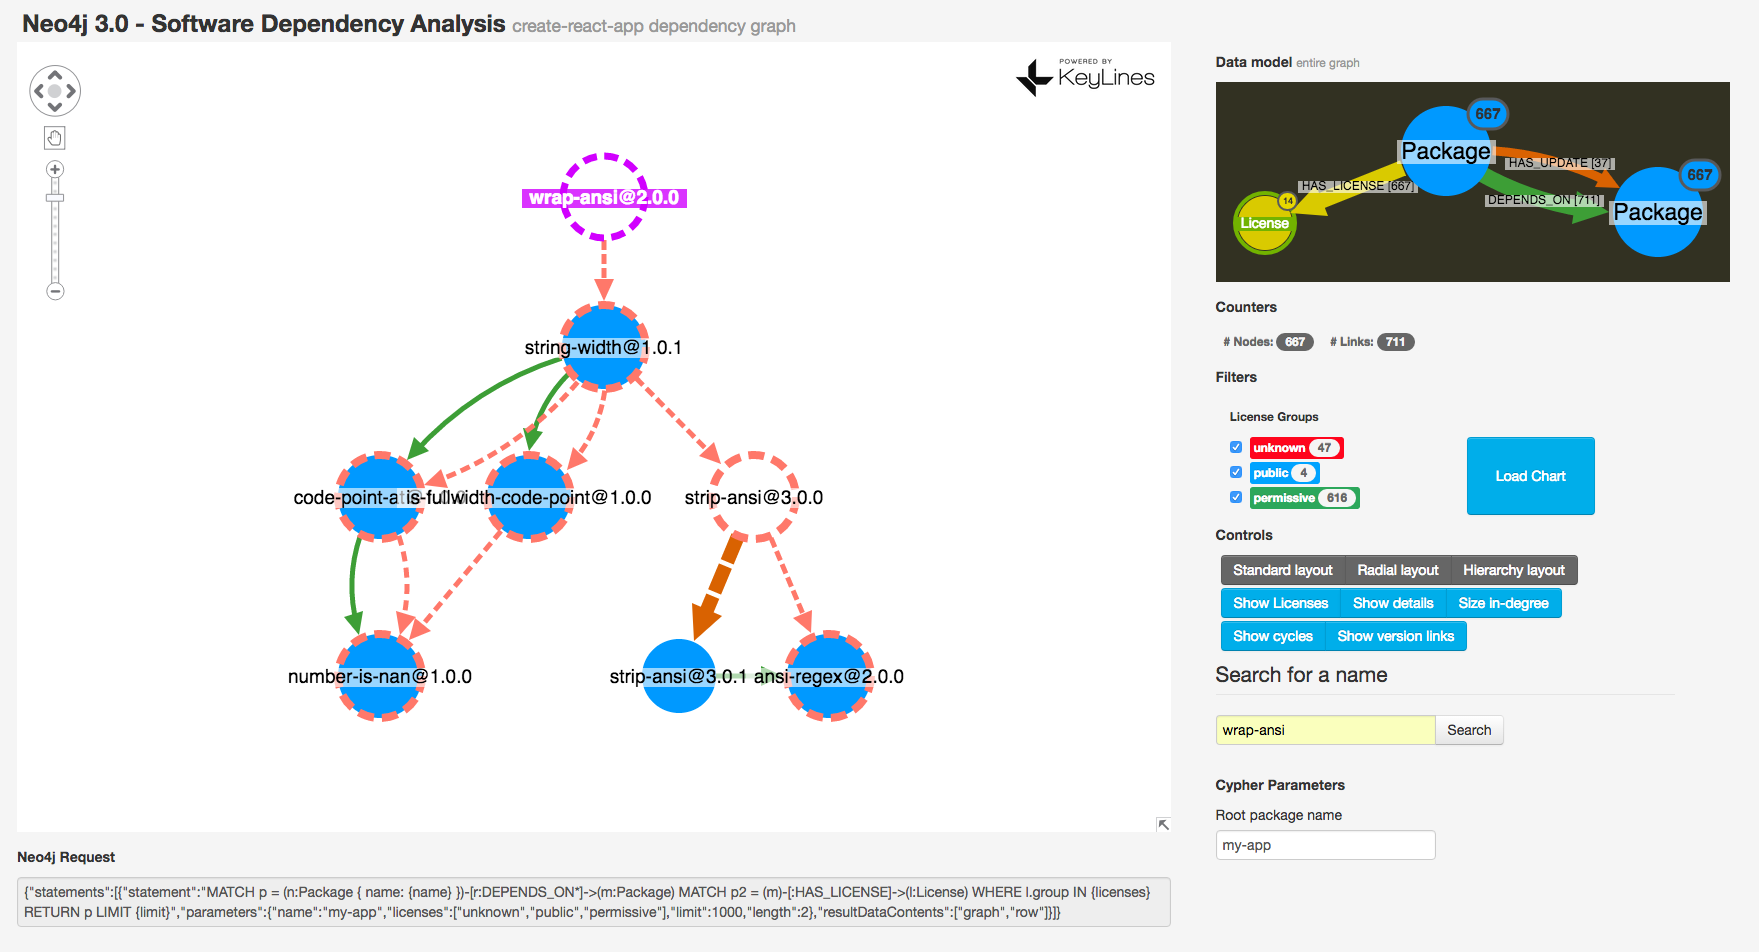
KeyLines makes it easy to focus on the sub-tree of the selected package with chart.graph().distances(id, { direction: 'from' }) and chart.filter coupled with the hierarchy layout. Here we can see that five out of the eight packages in the “new branch” (wrap-ansi) are already installed.
Try It Yourself!
What I’ve loved about building this graph visualization application is that at each turn I’ve uncovered new ways to explore my graph data, bringing fresh insight.
I’ve barely scratched the surface of what can be achieved with a Neo4j and KeyLines combo, but already I can see how valuable it is. Providing users with an intuitive, powerful and fun way to explore and understand their graph data helps them make better use of it.
The best way to learn more is to try it yourself! See the KeyLines website for details.
Click below to download this white paper, How Graph Databases Solve Problems in Network and Data Center Management and start managing your technology with the power of graphs.
Share Article


Explore
Related Articles


Text2Cypher Across Languages: Evaluating Foundational Models Beyond English


