
My Neo4j Summer Road Trip to the World of Healthcare [Part 2]
11 min read
Part 2: Visualize XML Files in Neo4j with APOC
Welcome back to my Neo4j summer adventure. In my previous post, I gathered all the available data and explored how to model the data into a healthcare graph. Starting with this post, I will be focusing on loading the data into the healthcare graph.
As a Neo4j newbie, before starting ETL, I researched on methods people have been using to transform XML data into Neo4j graph data. Most of them converted the XML files to CSV first then loaded the data into Neo4j. While I was teaching myself Cypher, I discovered that APOC allows me to extract information from XML and load them directly into a graph. However, there are few blogs out there that document this procedure, so why don’t I try the new way – it won’t be a real adventure without some fun explorations will it!
In this week’s blog, I want to show you how I load XML files into a graph using APOC. This week, I will be working with lobbying disclosures and contributions data, and by the end of this blog you will see some fun queries I created to gain interesting insights into how the healthcare system is influenced by the lobbying system.
Now let’s begin our adventure for this week!
1. Getting Ready
-
- Download the data into a directory:
In this project, I am working on XML data from 2013. The contributions contain 87.5MB of data and disclosures contain 894.9MB data. You can download the same data here:
-
-
- Lobbying contributions
- Lobbying disclosures
- Download the latest APOC:
- Install Python driver py2neo:
-
$ pip install py2neo
2. Data Integration
Now we are ready to go. Though Neo4j is schema-less, having a clear structure of the graph is helpful to determine where to go. It’s more like a map or compass, and this is especially true when I need to traverse an XML tree structure to access the child elements.
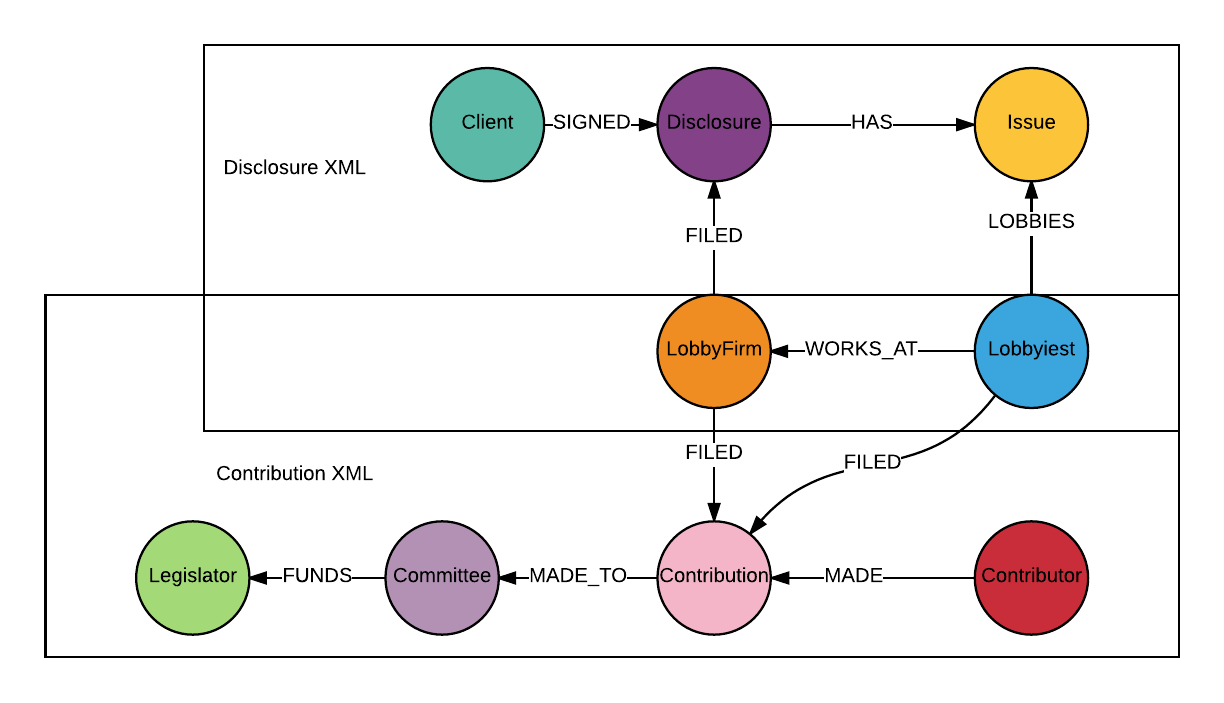
Now let’s take a look at the map of where we will be going for this week:
Nodes :Issue, :Disclosure and :Client will be extracted from disclosure XML files, and nodes :Legislator, :Committee, :Contribution and :Contributor will be extracted from contribution XML files. Both the disclosure and contribution XML data contain information about nodes :LobbyFirm and :Lobbyist, I will use a MERGE statement to create :LobbyFirm and :Lobbyist to prevent duplicates.
Now let me show you how I processed disclosure XML using APOC. (You can find the whole ETL python code here.)
A. Accessing Child Elements of XML in APOC
Let me start off by showing you the structure of the disclosure XML files.
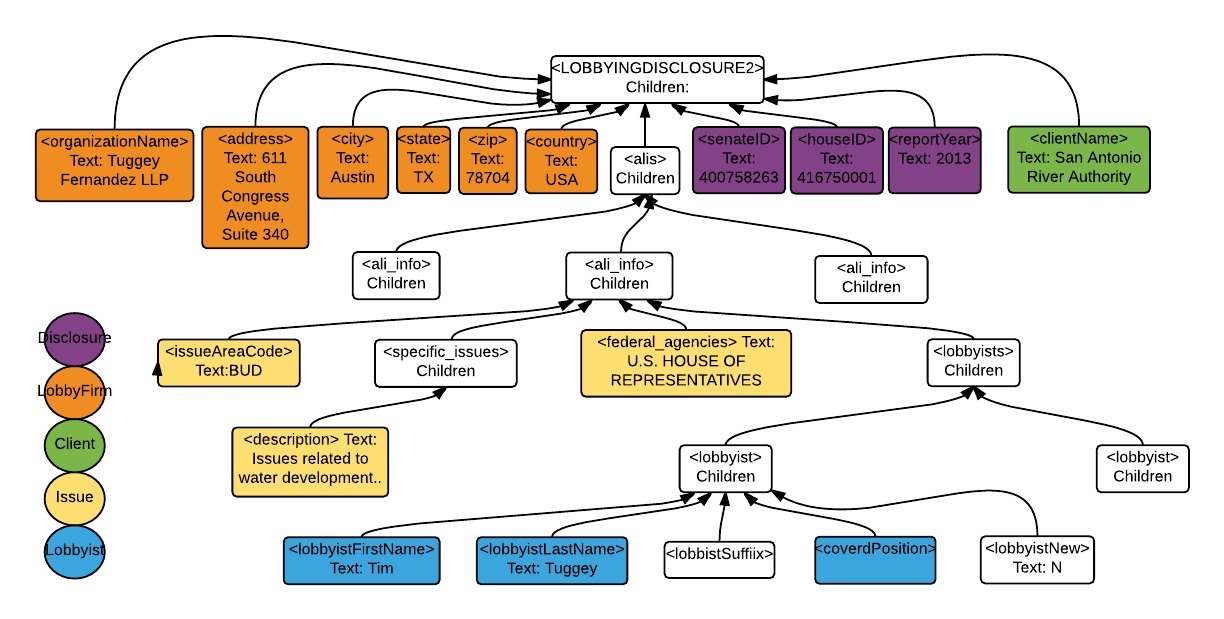
APOC allows me to access the child elements of <LOBBYINGDISCLOSURE2>. Here is the Cypher statement to extract the properties of :LobbyFirm (in orange):
CALL apoc.load.xml('file:///2013_1stQuarter_XML/300529228.xml')
YIELD value
WITH [attr in value._children
WHERE attr._type in ['organizationName', 'address1', 'city', 'state', 'zip', 'country', 'houseID'] | [attr._type, attr._text]] as pairs
CALL apoc.map.fromPairs(pairs)
YIELD value as properties
RETURN properties
The query returns this:

The way of calling APOC to extract properties for other nodes is very similar; you can
find every single detail of my Python code here. In this project, when creating nodes :Issue and :Lobbyist, I have to deal with more complicated parent-child structures (as you can see from the XML map above, <Lobbyists> and <issueAreaCode> are siblings, and <Lobbyists> has children <Lobbyist>; I maintained this structure in the healthcare graph).
If you are facing a similar problem, the collect() function will be helpful. I used it to aggregate properties (labeled in yellow and blue) into a list, then access the desired properties by indexing.
Now let’s run the query from the Python driver, I used py2neo in my project:
query = '''
   CALL apoc.load.xml({file})
   YIELD value
   WITH [attr in value._children
   WHERE attr._type in ['organizationName', 'firstName', 'lastName', 'address1’, 'city', 'state', 'zip', 'country', 'houseID'] | [attr._type,          attr._text]] as pairs
   CALL apoc.map.fromPairs(pairs)
   YIELD value as properties
   RETURN properties
   '''
properties = g.run(query, file=’file:///2013_1stQuarter_XML/300529228.xml’).evaluate()
print(properties)
print(‘type of properties:', type(properties))
Result:
{'city': 'Austin', 'organizationName': 'Tuggey Fernandez LLP', 'country': 'USA', 'firstName': None, 'houseID': '416750001', 'state': 'TX', 'address1': '611 South Congress Avenue, Suite 340', 'zip': '78704', 'lastName': None, 'address2': None}
type of properties: <class 'dict'>
Running the Cypher query will return a cursor object. In this case, I know there is only one value, Properties, being returned, so I could call the evaluate() method which returns the value of the cursor object. As we can see, evaluate() turns the cursor object into a dictionary which is very easy to work with in Python.
Knowing how to extract information using APOC and understanding the return value, I next define a Python function that cleans the data and returns a dictionary of properties of :LobbyFirm. Cypher supports some powerful string processing functions which can also be used to clean the data.
One more thing to notice here is that I only extract properties if the data is valid, NULL value properties should not be stored in Neo4j.
def get_LobbyFirm_property(file):
   '''
   :param file: the xml file path to be parsed
   :return: a dict of properties of LobbyFirm
   '''
   query = '''
       CALL apoc.load.xml({file})
       YIElD value
       WITH [attr in value._children
       WHERE attr._type in ['organizationName', 'firstName', 'lastName', 'address1',
       'address2', 'city', 'state', 'zip', 'country',
       'houseID'] | [attr._type, attr._text]] as pairs
       CALL apoc.map.fromPairs(pairs)
       YIELD value as properties
       RETURN properties
       '''
   pre_property = g.run(query, file=file).evaluate()
   property = {}
   # name
   if pre_property['organizationName']== None and pre_property['firstName'] != None and pre_property['lastName'] != None :
       property['name'] = str(pre_property['firstName'] + ' ' + pre_property['lastName'])
   elif pre_property['organizationName'] != None:
       property['name'] = pre_property['organizationName']
#address
   if pre_property['address1']!= None and pre_property['address2']!= None:
       property['address'] = str(pre_property['address1'] + ' ' + pre_property['address2'])

   elif pre_property['address1']!= None and pre_property['address2']== None:
       property['address'] = pre_property['address1']
#city
   if pre_property['city'] != None:
       property['city'] = pre_property['city']
   #State
   if pre_property['state'] != None:
       property['state'] = pre_property['state']
   # Country
   if pre_property['country'] == None:
       property['country'] = 'USA'
   else:
       property['country'] = pre_property['country']
   # zip
   if pre_property['zip'] != None:
       property['zip'] = pre_property['zip']
   # houseOrgId
   if pre_property['houseID'] != None:
       property['houseOrgId'] = pre_property['houseID'][:5]
   return property
B. Use MERGE and CREATE Statements to Load Data into Neo4j
def create_LobbyFirm_node(properties):
   '''
   :param properties: a dict of properties of the node
   :return: node internal id
   '''
   query = '''
       MERGE (lbf: LobbyFirm {houseOrgId:{houseOrgId}})
       ON CREATE SET lbf = {properties}
       RETURN id(lf)
       '''

   index = '''
   CREATE INDEX ON: LobbyFirm(houseOrgId)
   '''
   id = g.run(query, houseOrgId = properties['houseOrgId'], properties=properties).evaluate()
   g.run(index)
   return id
I decide to create the :LobbyFirm node by merging on houseOrgId which is a unique 5-digit number for each lobbying firm.
MERGE statement prevents duplicates in the graph. It’s a good practice to only merge on one property of the node. When merging on more than one property, only nodes that match ALL the values will be returned; otherwise, a duplicate will be created.
For example MERGE (lbf: LobbyFirm {houseOrgId: “12345”, firmName: “ABCD”}) is like saying “Find me the node labeled :LobbyFirm AND houseOrgId is 12345 AND firmName is ABCD. If no property is matched, create a new node with houseOrgId is 12345 and firmName is ABCD”.
In this case, there may be more than one node being created that has the same houseOrgId. Here is a great blog post that cleared up my confusions such as when to use MERGE vs CREATE.
C. Create Relations Using Internal Node ID
I have 72,002 disclosure files to be processed. As my Python code loops through each disclosure file, it needs to create relations among these nodes. A relationship is generated only when the two nodes are created within the same iteration. The graph created at each iteration looks like this:

Notice in the previous code where I created the :LobbyFirm I also returned the ID of the node. This internal ID allows me to identify the new nodes created at that iteration, and thus, I am able to generate relations for these nodes.
lf_dc_rel = g.run(
   '''MATCH (dc:Disclosure) WHERE id(dc) = {dc_id}
   MATCH (lf:LobbyFirm) WHERE id(lf) = {lf_id}
   CREATE (lf)-[r:FILED]->(dc)
   ''', dc_id = dc_id, lf_id = lf_id
)
Here dc_id and lf_id are passed as parameters, each of them represents the id of :Disclosure node and :LobbyFirm node.
There are some limitations when using internal node id to identify nodes. You need to be careful especially when you delete an existing node. The id for the deleted node will be reused when creating a new node.
In this case, you can use a plugin called UUID which “assigns UUIDs to newly created nodes and relationships in the graph and makes sure nobody can (accidentally or intentionally) change or delete them.”
3. Visualize the Healthcare Graph in Neo4j
Each year, corporations spend billions of dollars to gain access to government decision-makers, and healthcare organizations are no exception. One of the purposes of my project is to connect these organizations with the legislators by modeling the lobbying system.
Now that I have all of the lobbying data loaded into Neo4j, I would love to find out how the healthcare industry (or any other group) is influenced by the lobbying system.
First, let’s figure out the general lobbying issues in 2013:
MATCH (n: Issue) RETURN distinct(n.issueAreaCode) ORDER BY n.issueAreaCode
The query returns 79 unique issue area codes in the disclosures. You can refer to the general lobbying issue code to find out what these issues are. Here are the top 10 general lobbying issues in 2013:
MATCH (n:Issue) RETURN n.issueAreaCode, count(n) as num order by num DESC LIMIT 10
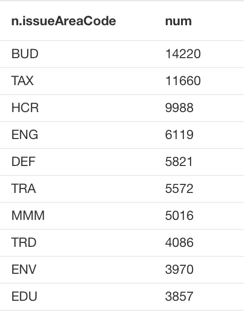
HCR (Health Issues) and MMM (Medicare/Medicaid) are the two areas that I am most interested in, and we can see there were 9988 HCR issues and 5016 MMM issues being lobbied in 2013.
Just for personal curiosity, I also wanted to know how many issues being lobbied are related to gun control in 2013, and here is a screenshot for my discovery:

Second, find me the lobbying firms and lobbyists who lobby for Medicare and Medicaid issues:
MATCH (lf:LobbyFirm)<-[:WORKS_AT]-(lob: Lobbyist)-[:LOBBIES]->(iss: Issue {issueAreaCode:'MMM'})
RETURN lf.houseOrgId as Frim_ID, lob.firstName as First_Name, lob.lastName as Last_Name, iss.issueAreaCode as Issue, iss.description as Description LIMIT 8

Next, tell me who are the clients that signed disclosures with lobby firms for Medicare and Medicaid issues?
MATCH (cl:Client)-[:SIGNED]->(dc:Disclosure)-[:HAS]->(iss:Issue{issueAreaCode: "MMM"})
WITH cl, dc, iss
MATCH (lf:LobbyFirm)-[:FILED]->(dc), (lob:Lobbyist)-[:LOBBIES]->(iss)
RETURN distinct(cl.clientName) as Client, lf.houseOrgId as Firm_ID, lob.firstName as First_Name, lob.lastName as Last_Name LIMIT 25

To visualize the result in a graph:
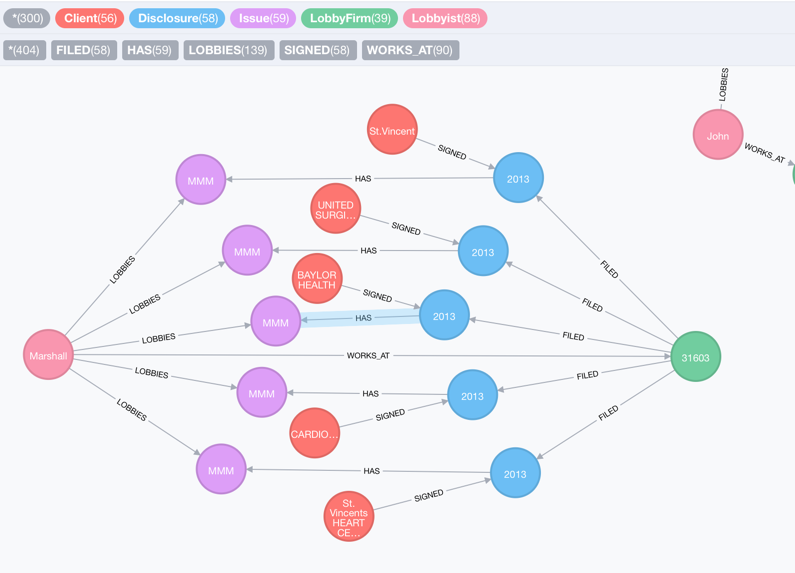
We can see there are five clients who signed a disclosure with lobby firm No. 31603 for Medicare-related issues. All of the relevant issues are lobbied by Marshall.
Now, let’s find out – for these lobbyists and lobby firms who are involved in lobbying Medicare and Medicaid issues – how much they contributed to government leaders and who received these contributions?
MATCH (lf:LobbyFirm)<-[:WORKS_AT]-(lob: Lobbyist)-[:LOBBIES]->(iss: Issue {issueAreaCode:'MMM'})
WITH lob, lf
MATCH (lob)-[:FILED]->(cb:Contribution)-[:MADE_TO]->(com:Committee)-[:FUNDS]->(leg:Legislator)
OPTIONAL MATCH (lf)-[:FILED]->(cb)-[:MADE_TO]->(com)-[:FUNDS]->(leg)
RETURN lf.city as City, lf.houseOrgId as Firm_ID, lf.name as Firm_Name,
lob.firstName as FirstName, lob.lastName as LastName, cb.amount as Amount, cb.date as Date, leg.name as Legislator LIMIT 50
What does the result look like in our healthcare graph?

It is much easier to read the results as a graph in Neo4j!
Finally, how are healthcare organizations connected to legislators?
MATCH (cl:Client{clientName:'Pharmaceutical Research and Manufacturers of America (PhRMA)'})-[:SIGNED]->(dc:Disclosure)-[:HAS]->(iss:Issue{issueAreaCode:'MMM'})<-[:LOBBIES]-(lob:Lobbyist)-[:WORKS_AT]->(lf:LobbyFirm)
WITH cl,dc,iss,lob,lf
MATCH (lob)-[:FILED]->(cb:Contribution)-[:MADE_TO]->(com:Committee)-[:FUNDS]->(leg:Legislator)
OPTIONAL MATCH (lf)-[:FILED]->(cb)-[:MADE_TO]->(com)-[:FUNDS]->(leg)
RETURN cl,dc,iss,lob,lf,cb,com,leg LIMIT 300
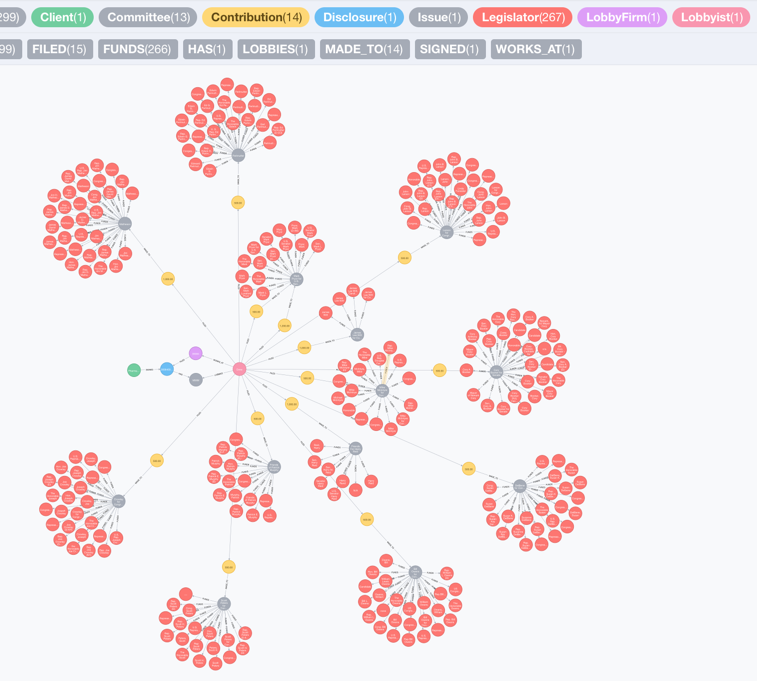
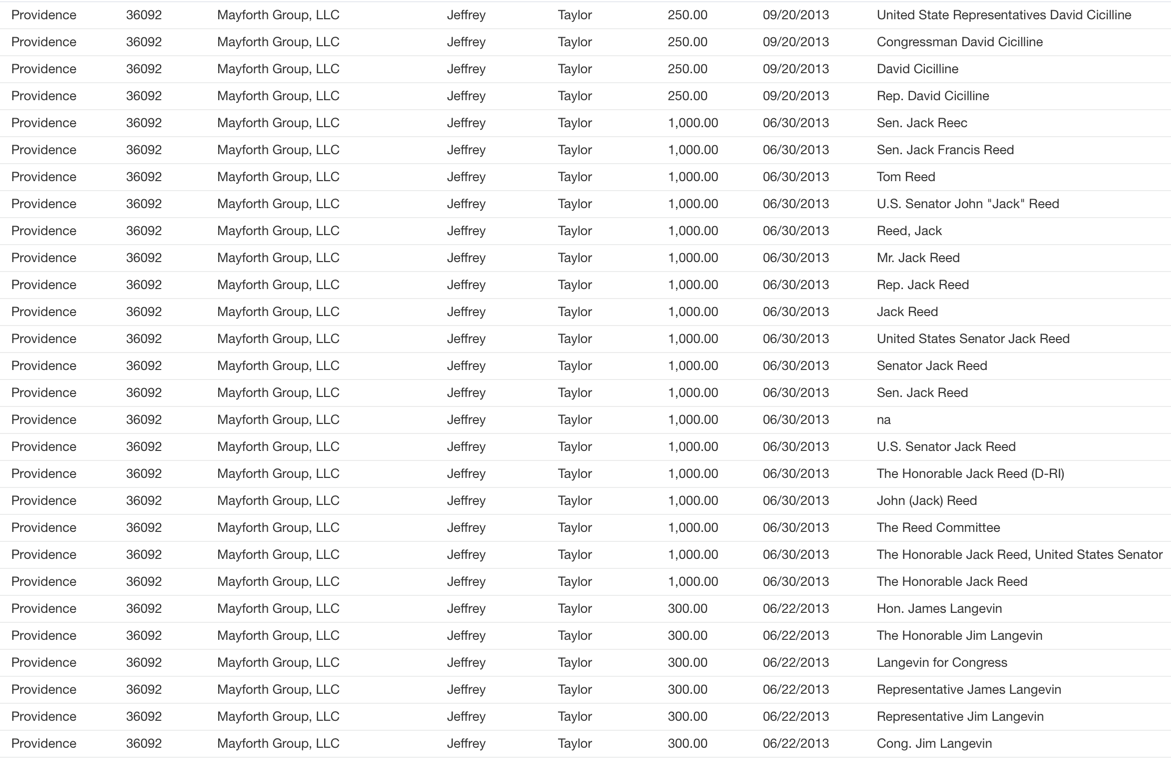
This looks amazingly interesting. Let’s take a closer look at the graph:

From the graph I can tell that in 2013, the lobbyist Drew Goesl lobbied a Medicare issue for Pharmaceutical Research and Manufacturers of America (PhRMA) which specifically focuses on “Legislative issues related to access to pharmaceuticals, including Medicare Part D, and Children’s Health Insurance Program (CHIP), rebates in Medicaid and for dual-eligibles; comparative effectiveness; 340B Drug Program; Medicare Part B prescription drug reimbursement, and related provisions.”
During the same year, the lobbyist Drew Goesl made contributions to several committees who fund legislators including James Lee Witt, Patrick Murphy, William Lewis Owens, Mike McIntryre, Mark Pryor, Corey Booker, John Larson, Linda Forrester, Edward Perlmutter, James Matheson, Joseph Crowley, Harry Reird, Susan DelBene, Scott Peters and Edward J. Markey.
Due to the data limitation, I cannot draw a conclusion that PhRMA and the legislators mentioned above have direct connections. However, the healthcare graph is helpful for the public to trace and integrate information just like this.
You may also have noticed there is a bug in my model: I have tons of duplicated nodes for the same legislator. This is because the data is not consistent. The real world data is not as friendly and tidy as might be the case in an academic scenario.
Conclusion
In the next few blog posts, I will demonstrate how to process strings and how to match nodes when you have messy and limited data sources. Next week, I will start to work on provider prescription data and will show you some tricks I used to load the large CSV files that I downloaded from the FDA and CMS websites. I hope you enjoyed the second post in this series – stay tuned for more excitements to come!
Ready to dig in and get started with graph databases? Click below to download this free ebook, Learning Neo4j and catch up to speed with the world’s leading graph databases.
Catch up with the rest of the Neo4j in healthcare series:
Share Article


Explore
Related Articles


How to Improve Multi-Hop Reasoning With Knowledge Graphs and LLMs
