Network observability using knowledge graphs at Commonwealth Bank Australia

Vice President, APAC Marketing
13 min read
Editor’s Note: This presentation was given by Stuart Horsman at GraphSummit 2022.
During Neo4j’s inaugural GraphSummit, we had the pleasure of hosting partners and customers to share insights and stories behind their connected data experiences. We will be featuring more of them in this series of blogs – so watch this space for more recaps.
For the second presentation in the series, we’re featuring Stuart Horsman from Commonwealth Bank Australia. He shared the story of CBA’s journey to knowledge graph while chronicling some of the successes and challenges they faced along the way.
Enjoy! And for more information, please write me at [email protected].
In 2020, Matt Comyn [CEO of Commonwealth Bank Australia (CBA)], decided it was time to move the bulk of CBA’s digital assets from on-prem to the cloud. During this time, I worked in advanced analytics for IT risk stability to predict service payment outages.
What quickly became apparent was the graph structure of payments. Payments have a lot of interdependencies and we called these connections transitory relationships. A service manager owns service A. He knows service A depends on service B. Service B depends on service C. Therefore, we can say that service A has a transitory relationship to service C.
The problem is that it’s very difficult for a human being to manage all these transitory relationships. In fact, it’s hard to insert this information into a relational database. At the time, our database couldn’t even hold these transitory relationships and only looked at one-hop relationships from the service.
Network as a graph
We started to reason about the network as a graph and, unbelievably, started by loading our data into igraph on R. Luckily, we soon learned about Neo4j. I actually installed the initial R driver that connected to our Neo4j open source database, where we could suck the data back into R and run graph algorithms.
We started asking questions around how we could de-risk CBA’s cloud migration. It’s quite easy to move a virtual machine from on-prem to cloud if it has no dependencies. However, with more complicated cases, you have to determine what other services depend on it and what those depend on. This becomes much more difficult, which is why we decided to model it.
We did not initially have data for the thousands of servers in our data centers. We didn’t know what application functions these servers were providing and to what higher-order level these services worked for, such as payments or loans. We were only able to see service dependencies one-level deep due to the way we had stored the data.
Document graphs: Finding the right data
Our first iteration of Neo4j can be described as a document graph because we knew the data we started with was incomplete. At the same time, we knew there were other IT monitoring and management tools we could ingest data from and do entity resolution with. For example, tools like Qualys scan for vulnerabilities and can also return useful metadata, such as host name, IP address, and fully qualified domain name. For this project, we weren’t interested in the vulnerabilities Qualys surfaced, but we were interested in where things exist on the network, what their IP addresses are, and how long they’ve existed for.
Combining Qualys data with other network information was like trying to solve a large jigsaw puzzle. We were able to use them together to resolve entities and create the graph. We started by loading these documents into the database and then created a “metahost” node from a server or a VM that we’d seen on the network and started to create linkages. We’d then try to map this node back to a row in our relational database. This made it easy to ask questions like “What is not in our original database?” or “What’s in the database but has a decommissioned status and is still alive on the network?”
From here, we could create an orphaned asset list, which we shared with service managers to find out who actually owned certain systems. Of course, no one actually put their hand up to say that they owned them.
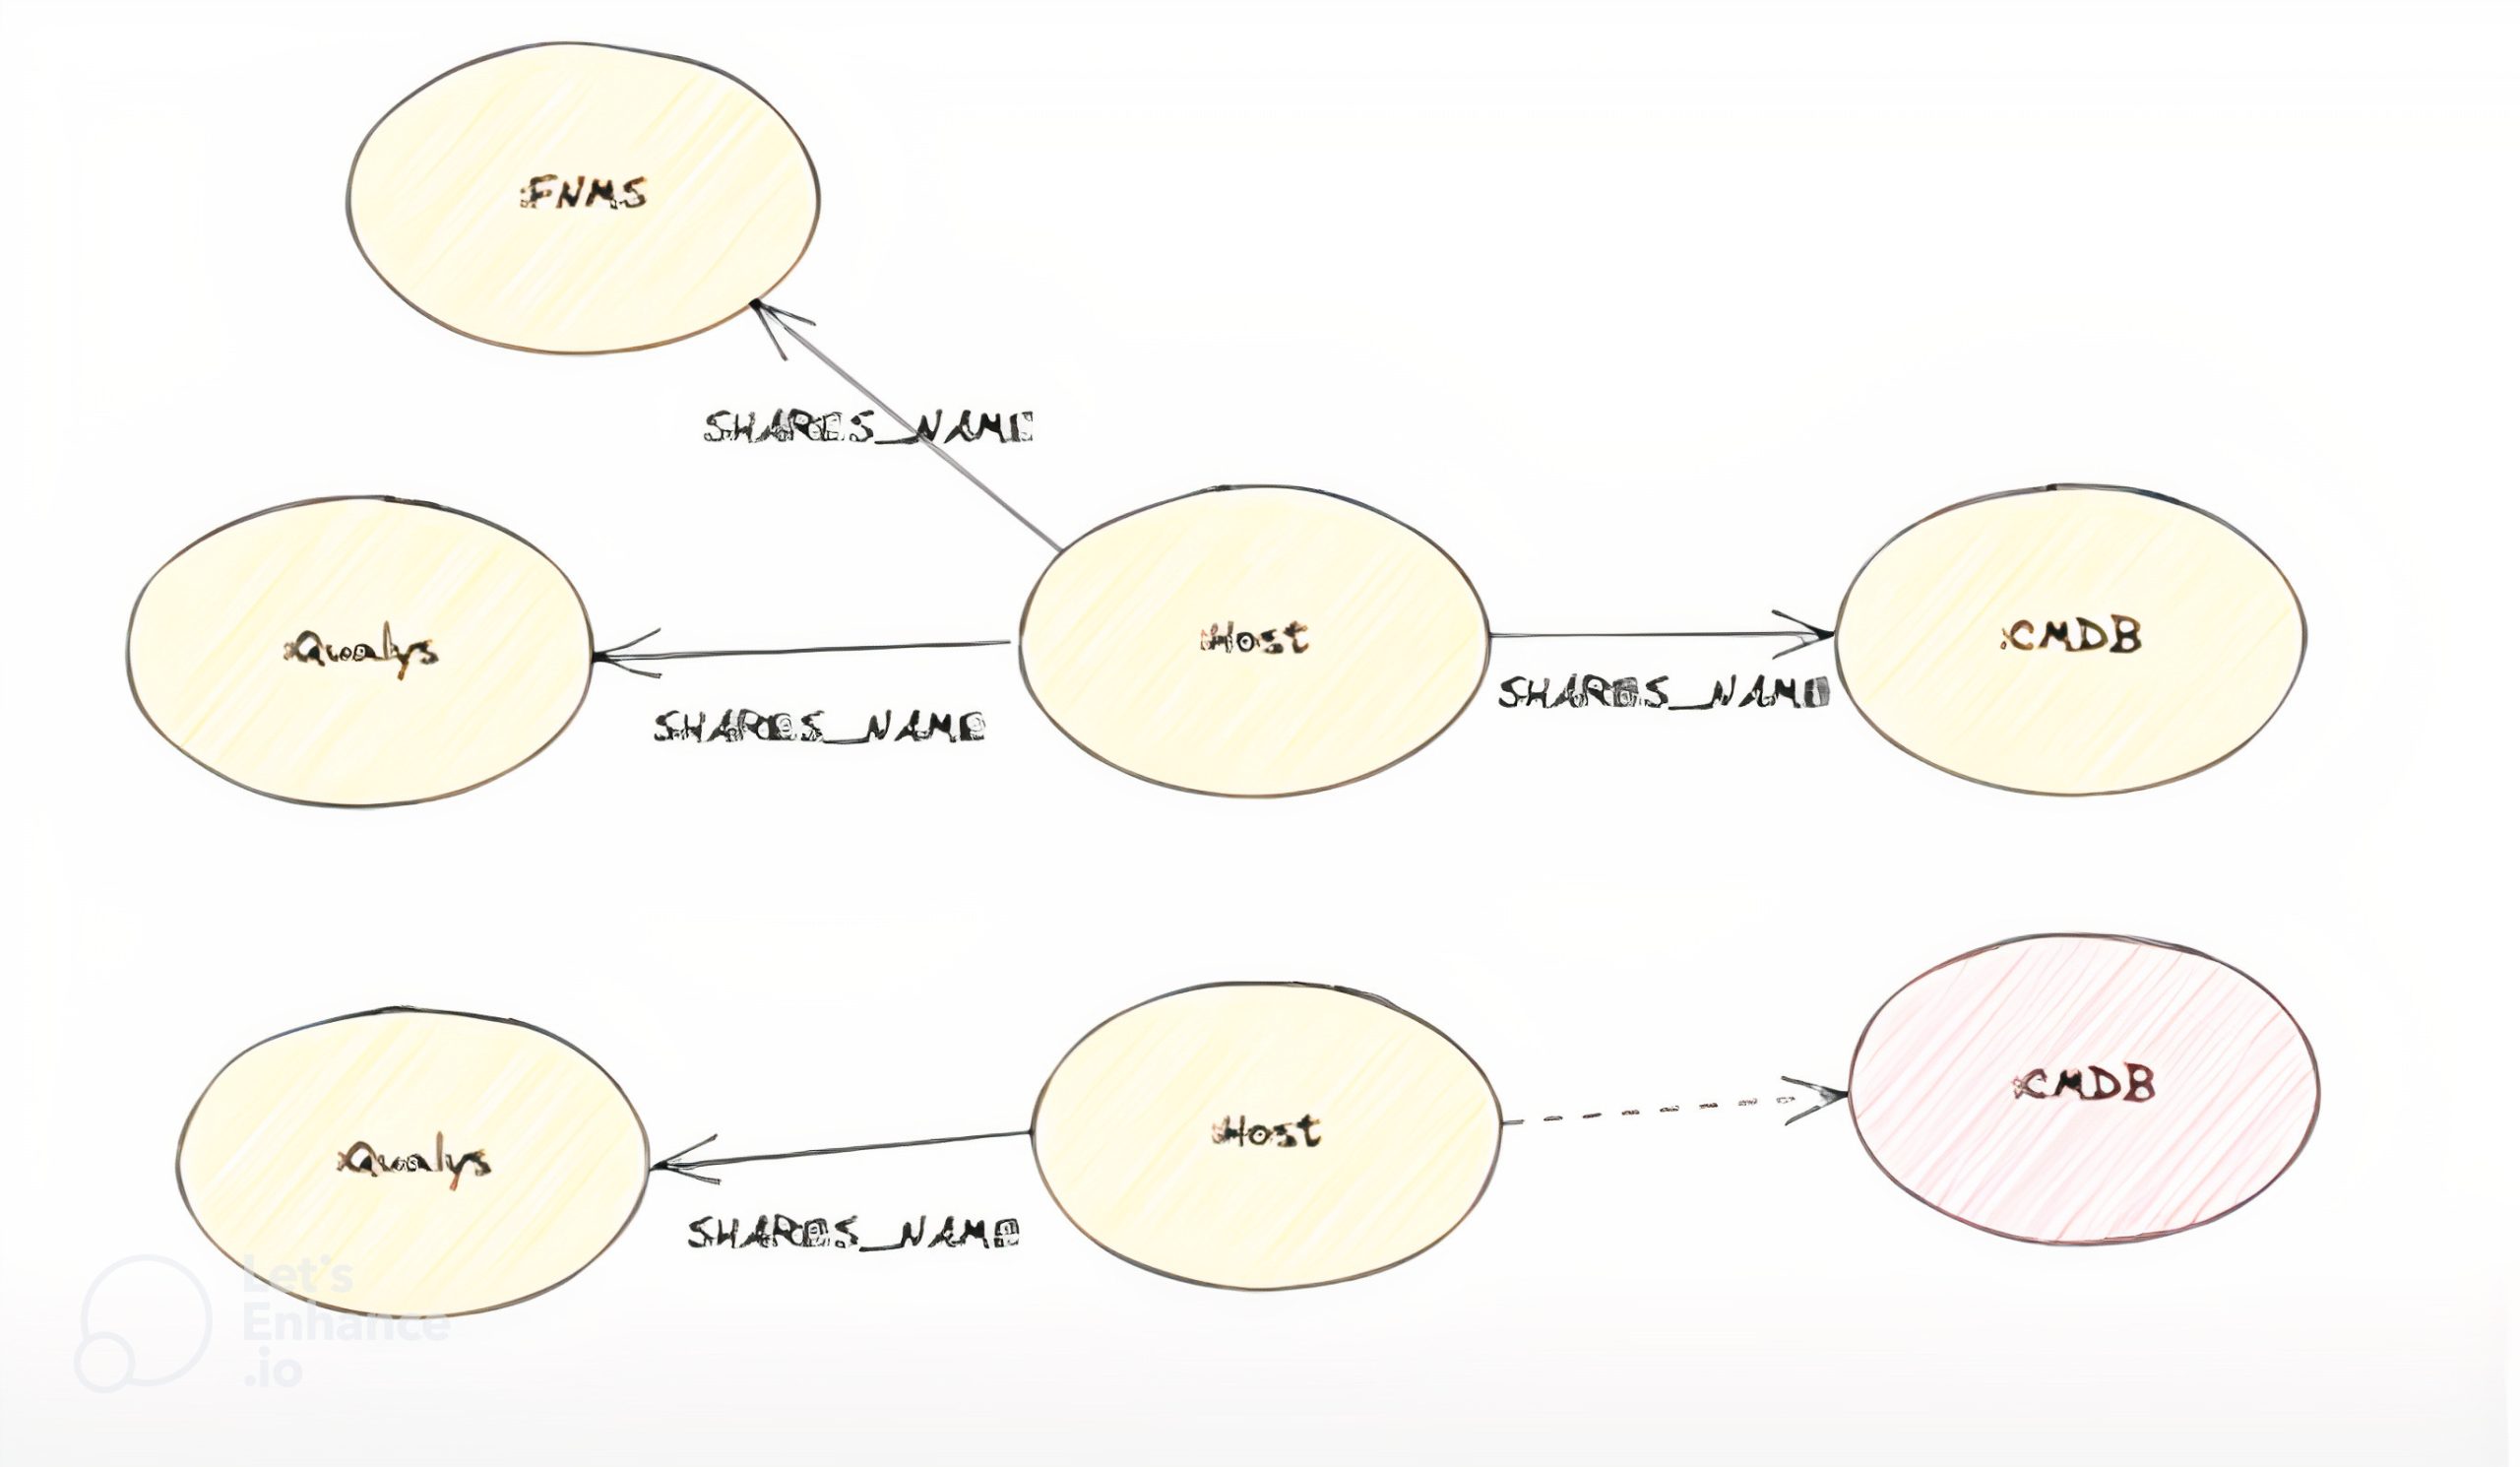
Unfortunately, this process didn’t scale very well. As we kept onboarding more systems, we ended up with more labels we had to map to these systems, which increased the linear number of optional matches to make. Due to this challenge, we shifted to a model that looks like this:

Document graphs: lessons learned
There were some good things from the original document graph-type:
- It was very easy to extend.
- It was easy to map new data sources to new node label types.
- Recording linkage semantics, like a name or serial number, was kept intact for all the records we tried to link.
- It was easy to reason about data because all the attributes were on nodes, and nodes had clear links to a metahost.
- All the data was isolated, so there wasn’t any attribute collision. For instance, we didn’t have to think about the challenge of merging properties onto the same node.
These benefits aside, there were still some issues in the user queries. The match statements were slightly longer than we wanted them to be, and it was difficult to train new users because each query required the user to describe the context of the source systems and why they existed.
Knowledge graph

We ultimately transitioned to a knowledge graph. Above is our most current, simplified data model. In this model, an IT service is just a logical grouping of computers. A host in this model has an interface. A host could have multiple interfaces and can be connected to multiple networks. Those interfaces have IP addresses. As mentioned before, the host might also share a name with some entity that’s in our relational database. IP addresses belong to some network.
We expanded the host classification. It was originally just a generic label we gave to some workload in the data center, but now we are collecting more and more attributes and can classify and tag.
Network graph
When we built our model, we built in vertical relationships but didn’t have any horizontal relationships. We wanted to know which IP addresses talk to other IP addresses, on which ports, and when. Iris, a parallel project, collected flow data from across our entire data centers and cloud and put that information into Kafka to process daily.

These are a few lines from records we receive each day: the time the flow started, source IP, and the destination IP (which I’ve masked). We get billions of these records and really want to summarize the data into something that looks like this:

On any given normal business day, we receive about 8 billion flows, which we process. Iris currently stores about 240 billion rows of data. For our knowledge graph, we take many, many, many rows of flow data, group it, compress it down, and then insert just the aggregated record via Kafka into Neo4j. This gives us a real-time view of flows on the network.
Once a relationship is established between two IP addresses, we create dynamic metadata around the relationship itself. In the relationship, the port and protocol are fixed, while the bytes and count are bumped up as more data is passed through. When the relationship was created is also a fixed value, but the last seen relationship is a dynamic value.
Passing this traffic data into Neo4j forced us to consider the scale of the system. It was difficult for the system to run 200,000 transactions per second, so we had to get a bit smarter to segregate our traffic. We decided that for the dynamic metadata we were creating, we don’t need “management traffic” or the traffic required for computers to exist. What we’re really interested in is the application traffic or anything that’s coming across 443 or port 1521, for instance. We treat these traffic flows separately and inject them in different ways.
In our data center, having a static IP talk to another static IP is fine. The machines here never change their IPs because they’re up all the time. In the cloud, it’s different. Nobody cares about the IP address because the machine might only be yours for a few hours.
When the VM spins down and then comes back up again, it’s got a different IP but has the same workload. In our knowledge graph, it’s the same object. This means there’s a temporal aspect involved in IP allocation, which we’re starting to think about now: What host had this IP address? At what time? In what routing domain? There are a lot of private networks in AWS that actually clash with other networks outside of CBA that we pick up on our security scanners.
For instance, there are people working from home. We have a lot of these networks, and if you run subnet tree allocations, you find that the workforce can actually get allocated into the wrong part of the network. We’re trying to solve this challenge now.
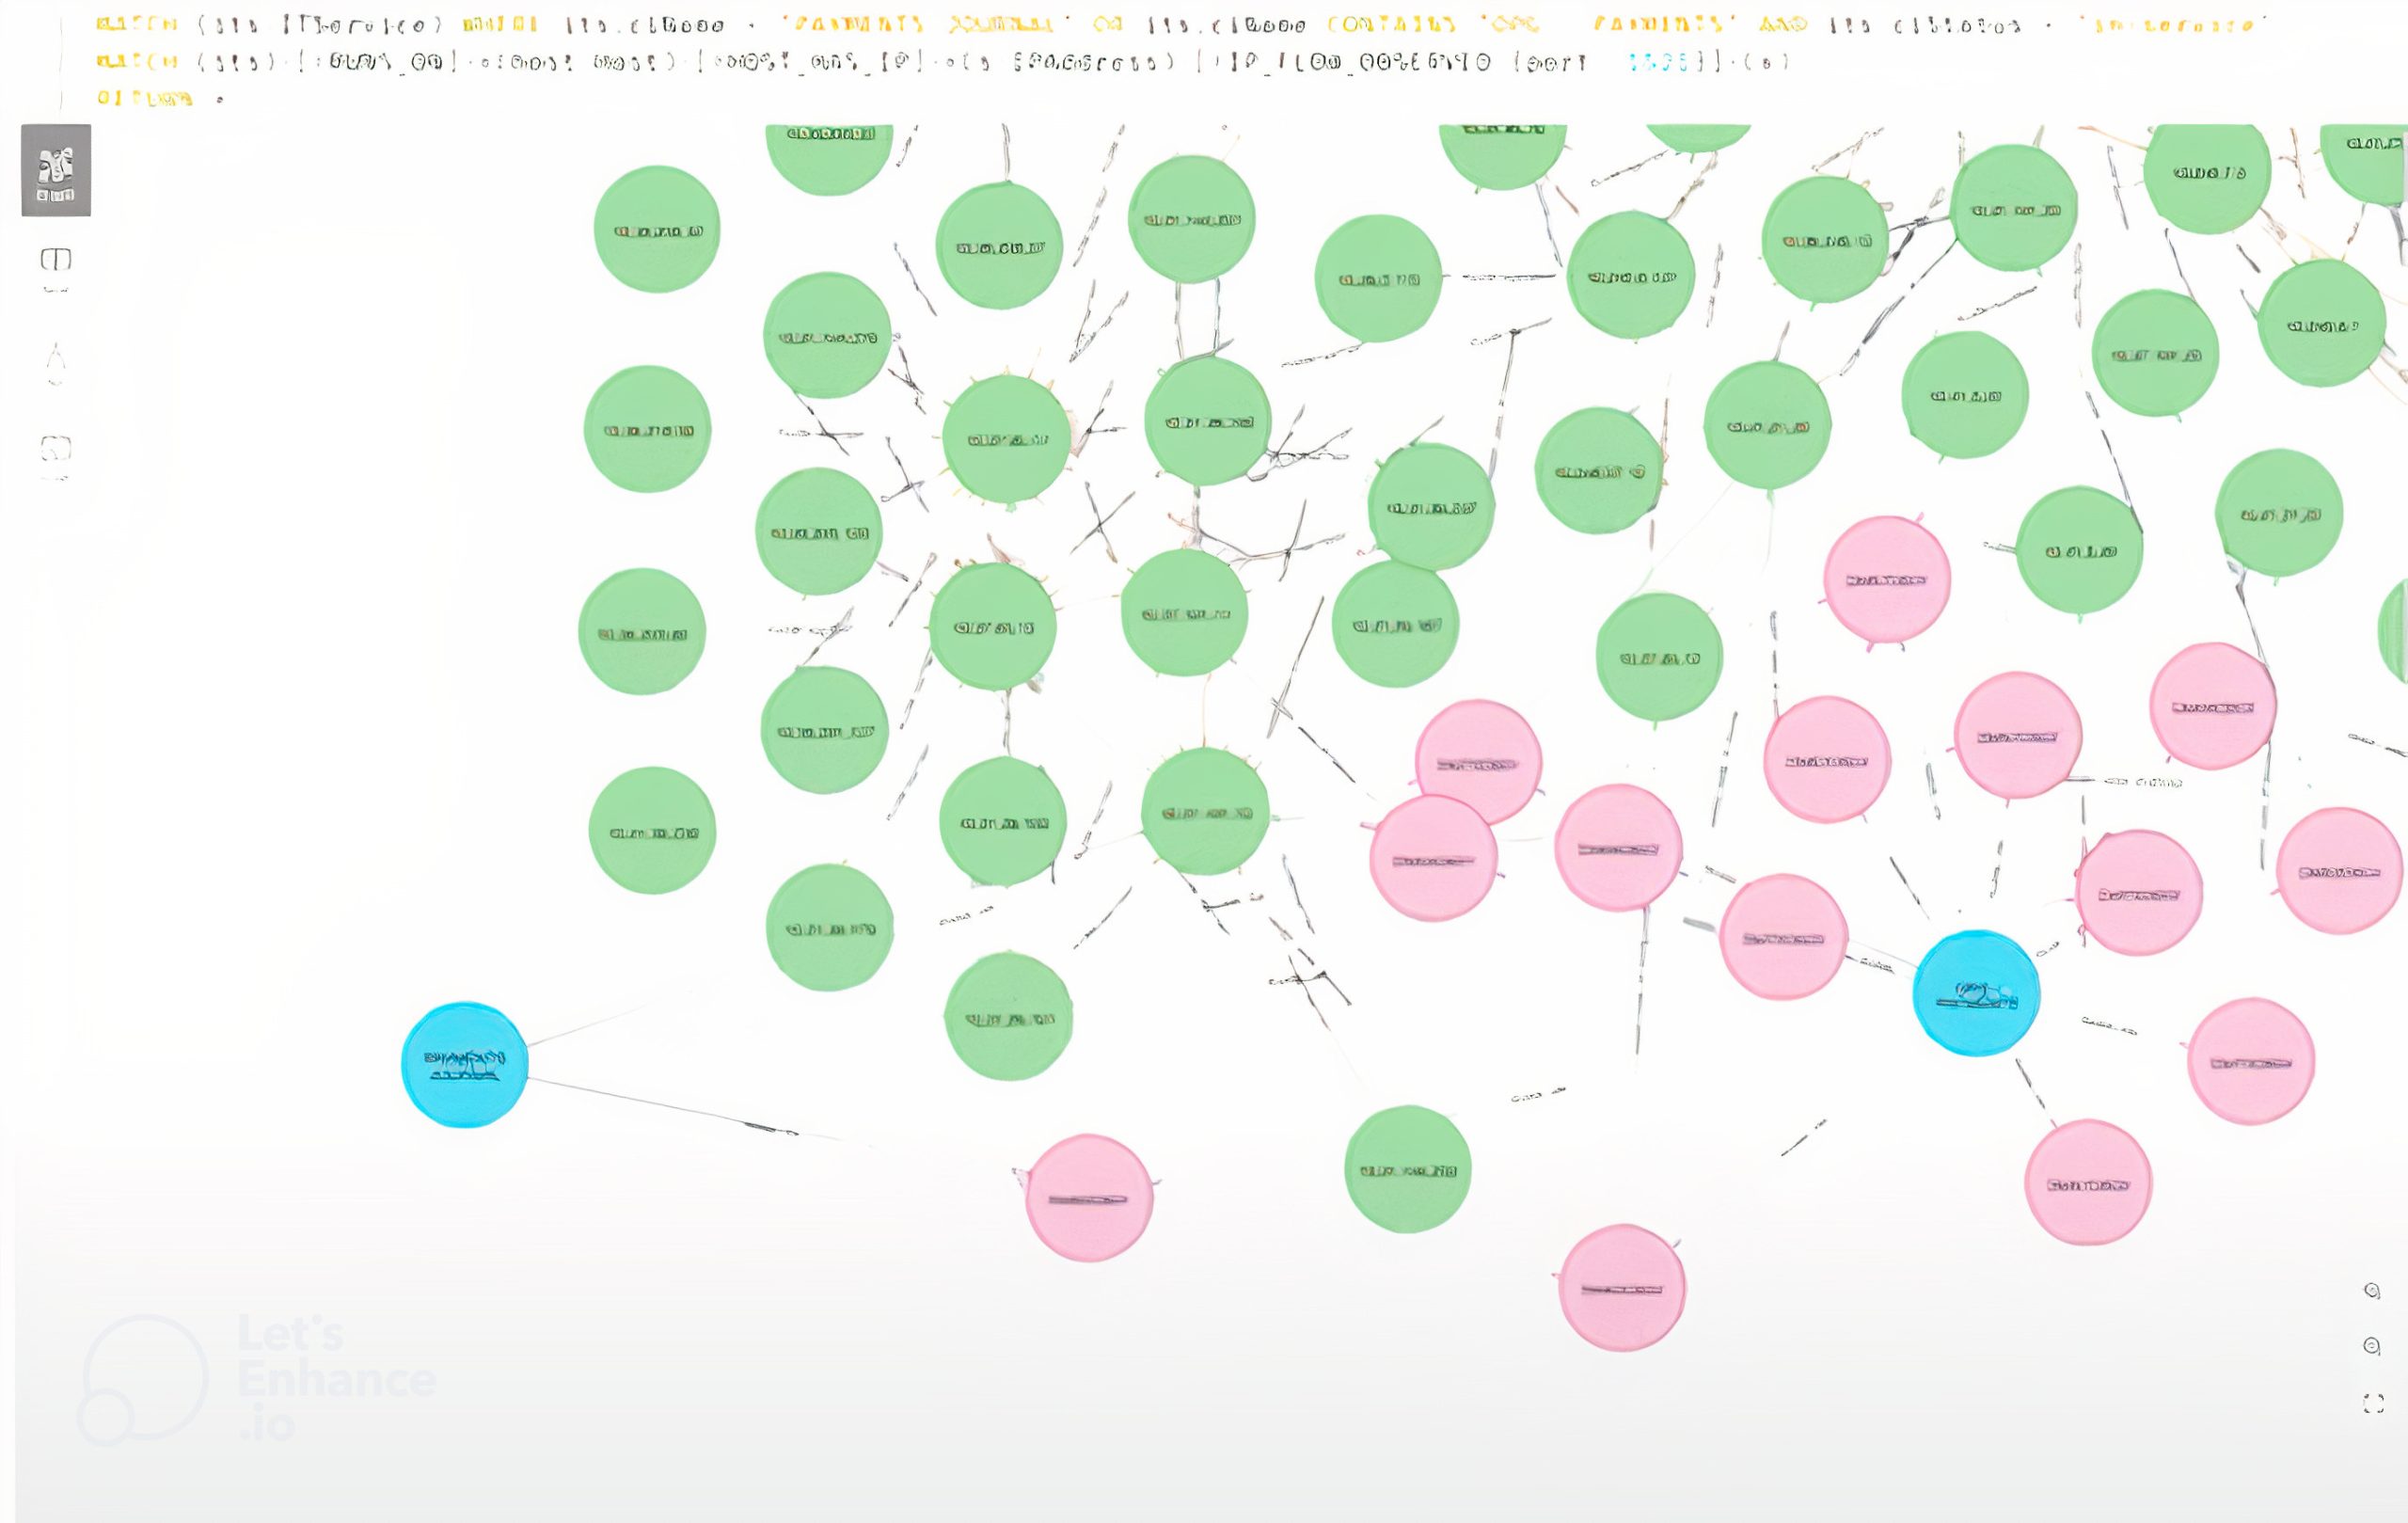
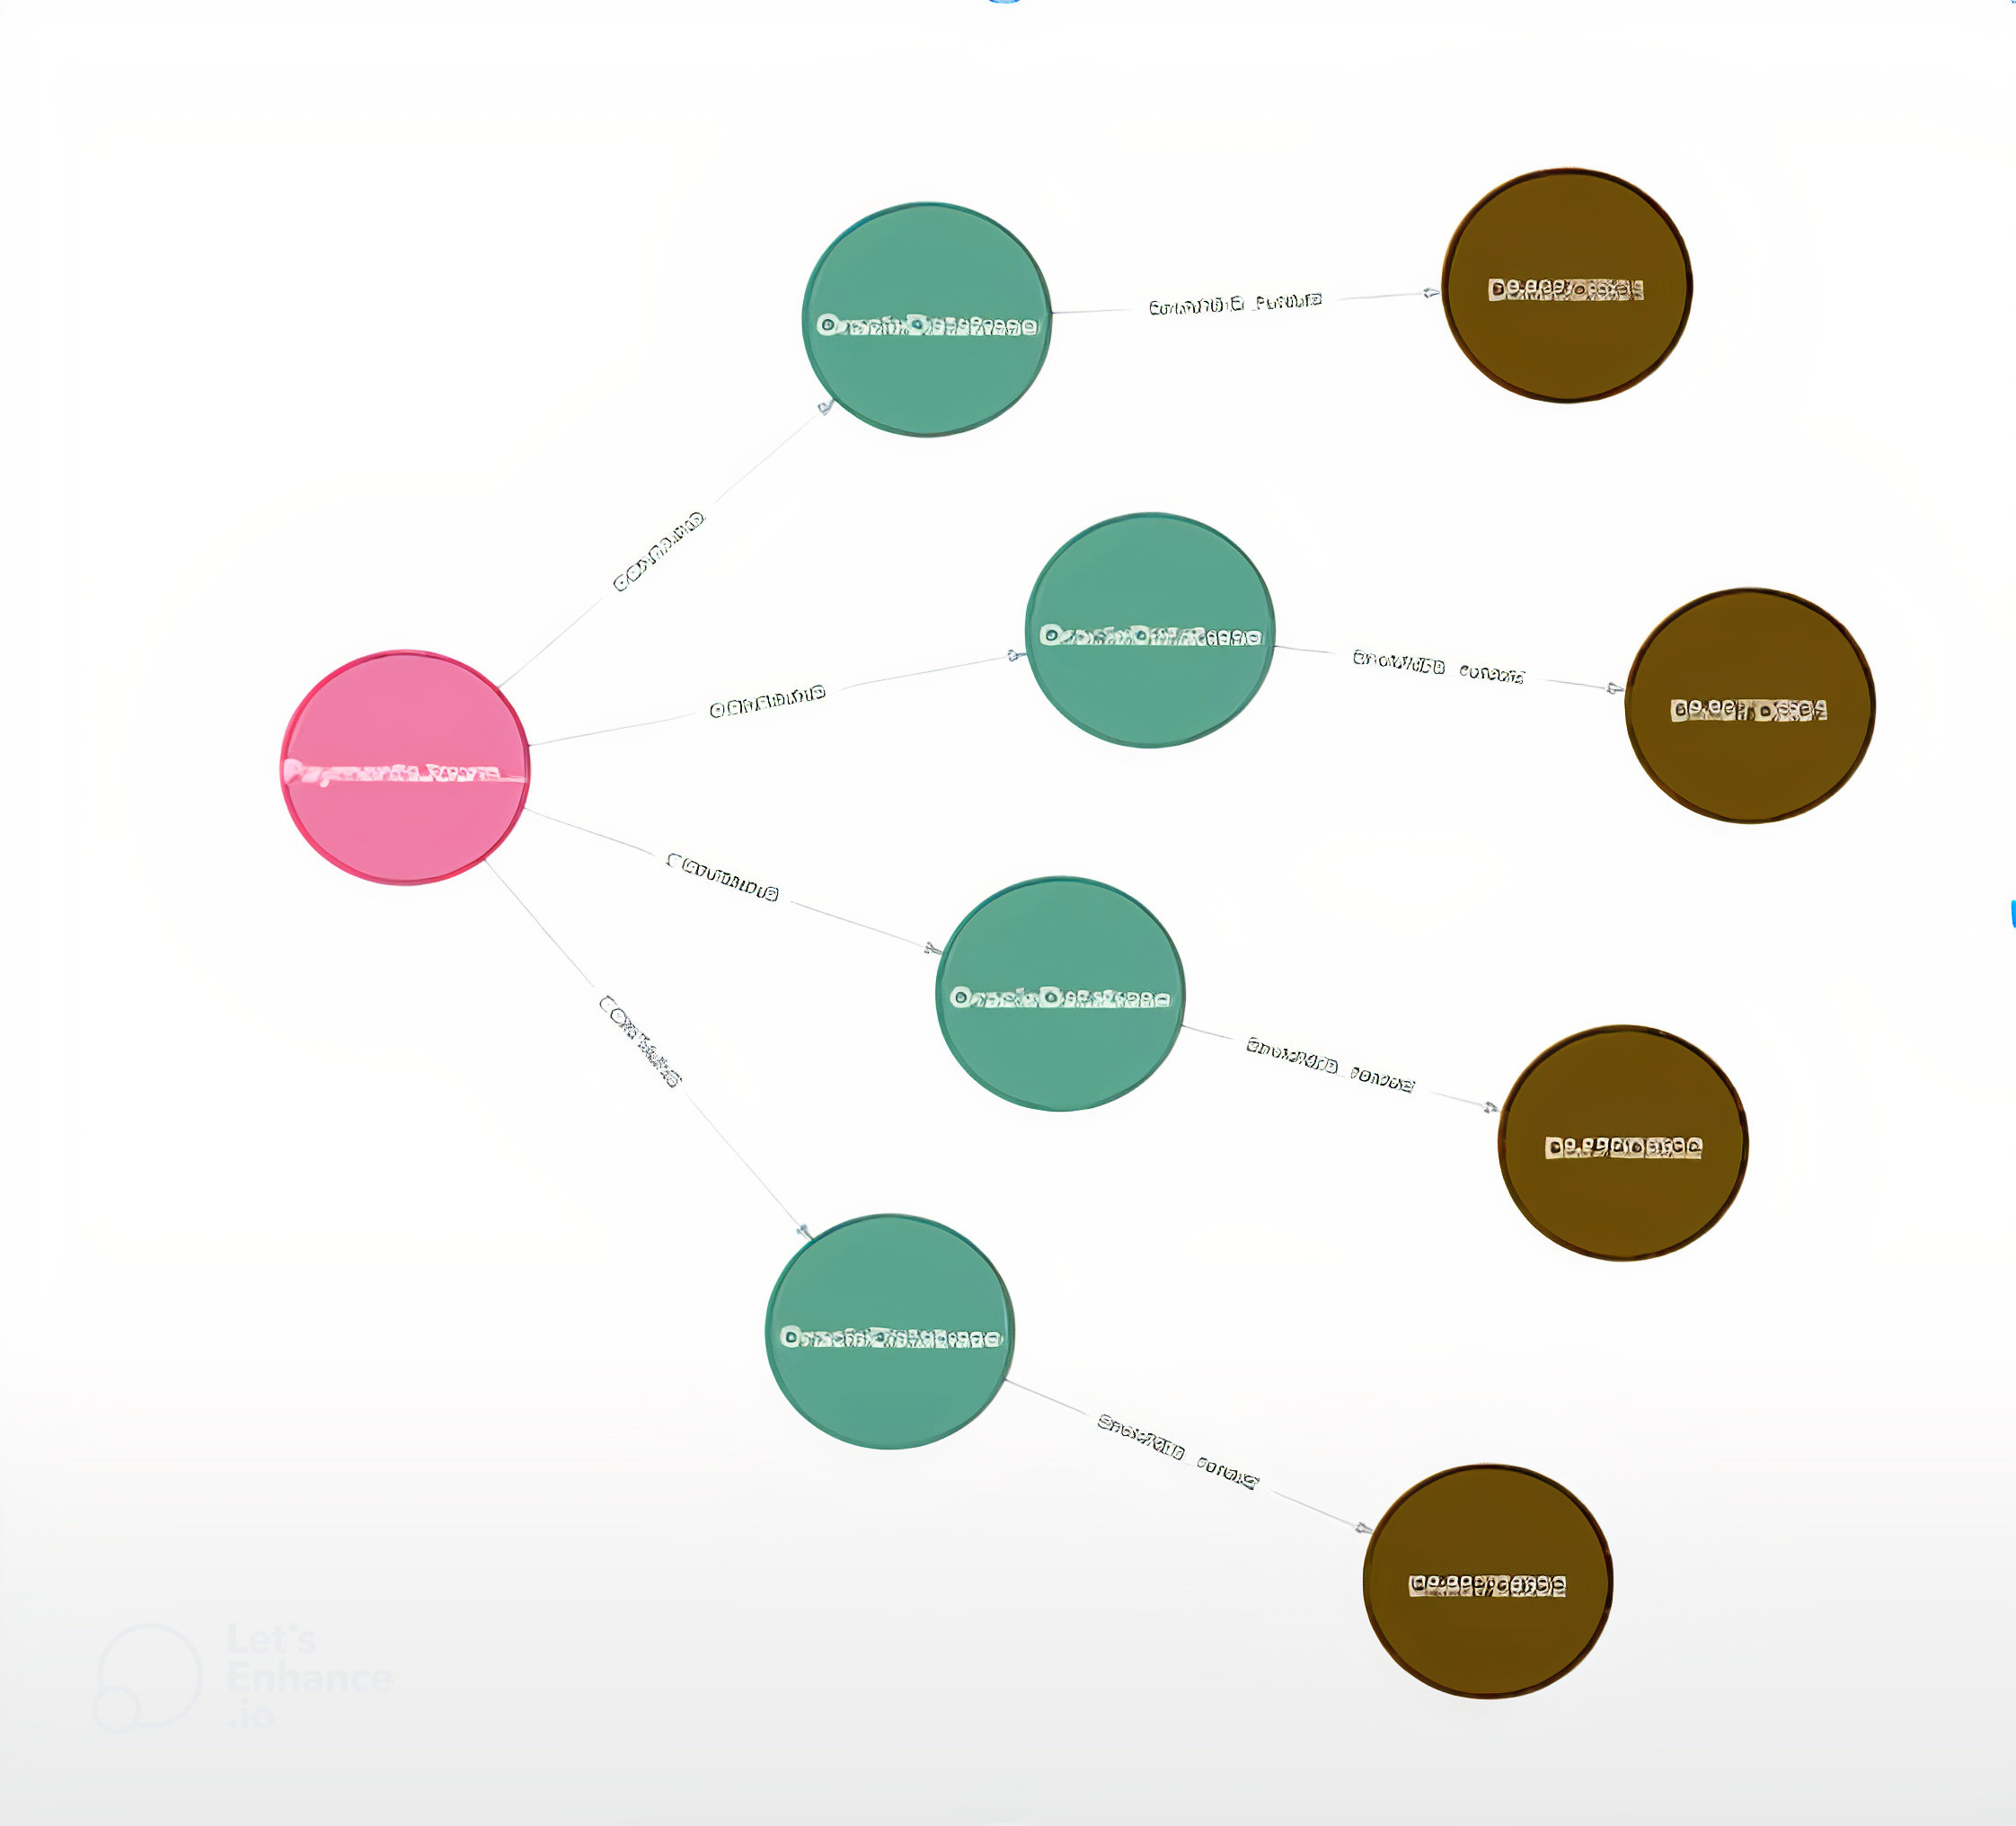
This example here is another problem around entangled nodes. The blue nodes are IT services, that’s PaymentsJournal on the left, and our Oracle Platinum grid is on the right. The green nodes are our IP addresses, and the pink nodes are machine nodes. We can see that these two IT services are sharing the same node. This is an entanglement problem; if I was actually going to move that node to the cloud, I’d have to deal with those two services and they might have different SLAs going out to market.
Network flow policy: Observability to enforcement
Commonwealth Bank Australia has run traditional network segmentation for security, which essentially says there are a bunch of computers in production that need to be in a collection to allow them to talk to other production domain computers, but we don’t care what those computers actually do. We only care what network they’re actually plugged into. This is fine if you have a static data center, your networks never change, and installation of new computers is well-governed.
When you go to a dynamic environment like AWS, then somebody might want to spin up a new production service and connect to something that’s in our data center, and we have to manage that connection differently. We add more attributes into this workload to determine the workload that’s trying to connect to this production and if it’s allowed for the transient time it might be alive. We’ve started to model flow policy in Neo4j as an abstraction away from IP addresses or firewall-based rules.
In this example, we have PaymentsJournal with four hosts that have IP addresses and flows underneath them. In the database, we can tag each one of these as a workload and prescribe a policy. For instance, this workload might get ingress on 1521, and that function then follows that workload around, even as it changes hosts and IPs. This actually shifts the firewall policy up from the host to the workflow level.
Cybersecurity

Cybersecurity is a really interesting use case for our knowledge graph because we have complete network observability and can calculate metrics around the shape of the network. These funny blimp shapes are network scanners that are scanning core pieces of the network. We went to our cyber security team and asked if they could confirm if these were their scanners and they came back and told us: “These are a lot more than what we thought we had.”
We were also able to say which parts of the network they might be missing, to which they said: “Who are you and why are you giving me all this information?” All joking aside, we’re working with them to extend their Qualys coverage because we use it to see the whole network and what their scanners are doing. Interestingly, we can actually see internal cyber security “red teams” when they plug in and try to hack us from the inside. We’re able to observe them in real time as they start to scan parts of the network.
Our journey so far
We’ve been on this journey for a couple of years and we’re still in the process of transitioning our workloads to the cloud. Right now we have our knowledge graph creation set up as a batch system, meaning we load the data when Neo4j boots up. This has actually worked quite well for us up to now because it’s actually quite easy to reason about the state of your database if it’s fixed. If the database is in read-only mode, you can count the number of nodes, count the number of labels, and count nodes by data source type. There are many ways you can calculate these metrics. If there is a change made to the database, we can easily see what changed in the metrics and if something is broken.
Now, because we’re onboarding a lot of AWS and Azure data, when we hit the API and extract all the data, manipulate it and then load it into the database, we have to do it again. This is because of the temporal nature of the cloud. We only see it at that point where we hit the API. What we actually want is the event stream. We’re moving to go live with a pure, real-time database where events come in and we mutate them in real time and then mutate the relationships around the node as well.
Our data model has been through many changes and will continue to change. When we onboard new parts of the network, like we’ve gone through with AWS data modeling, there are questions around how we model internet gateways compared to transit gateways and things like that. We had to whiteboard how AWS names these and how our business internally names these before ultimately landing on a shared name. (Fortunately, this isn’t a problem in Neo4j because you can give a node multiple labels). This whiteboard process is crucial because what you have on your whiteboard becomes the data model for your graph.
At CBA, we love that analytics people who know SQL find the crossover to Cypher relatively simple. They understand the selector, the match statement, the where clause, and projection. However, not everybody is going to learn Cypher, which means you have to accommodate these users to get the best out of the graph database.
We’ve found Bloom useful because it allows users to take complex Cypher and embed it into actual UI without having to write any code. In fact, we’re playing with Bloom as a way to make data updates in the graph itself by using its ability to right-click and update data. We have such a powerful knowledge graph and want to allow as many people at CBA to use it, even if they haven’t learned Cypher yet.
Share Article


Explore
Related Articles

Neo4j Named “One to Watch” in Snowflake’s 2026 Modern Marketing Data Stack Report


1 of 3: The difference between a graph, a knowledge graph, and a context graph

2 of 3: Why graphs, knowledge graphs, and context graphs matter to customers