A New Approach to Visualizing Spatial Data

Lead Technical Design Architect, Tom Sawyer Software
3 min read
A Preview of Tom Sawyer Software’s Geographic Drawing Views
In response to customer needs, we have developed a new way to visualize spatial data that combines the power of our existing rule-based graph drawing and the Open Layers map library. We call this new technology Geographic Drawing Views.
By combining logical graph drawings and maps, we are able to introduce features that were missing in each of these technologies separately.
Map View with Rich Visual Objects
With geographic drawing views, you are able to use our rule-based, data-driven graph visualizations with custom and information-rich maps. Access spatial data from private or public map providers, or generate custom map layers with information embedded directly in the map to produce heat maps.
Using rules, you can define visual objects on the map including:
- Nodes and node labels
- Edges and edge labels
- Connectors (sometimes called “ports”) and connector labels
Using our rich graph visualization engine, you can create data-driven node and edge visual representations, and define different level-of-detail representations that can change visual representation at different zoom levels and other different user interaction conditions.
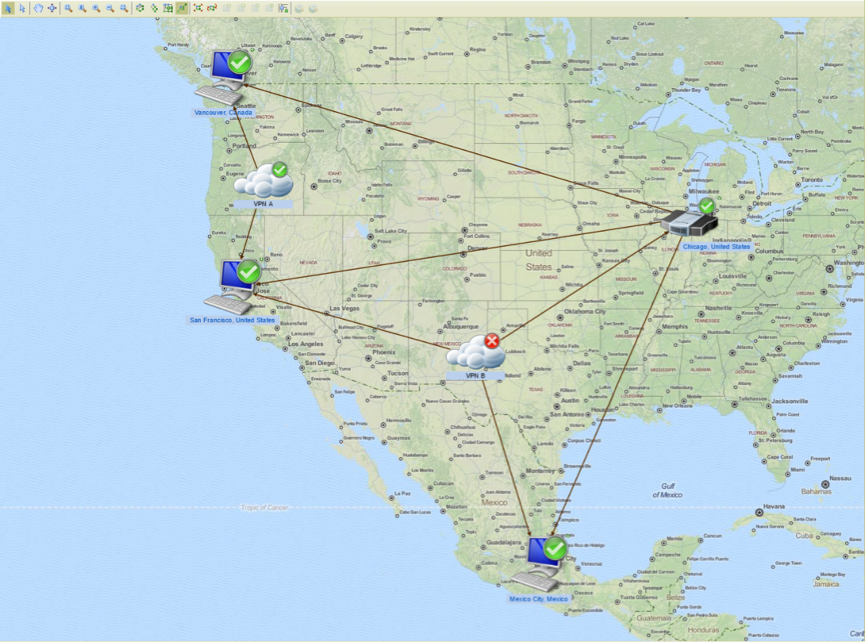
Figure 1. Drawing with geographically-positioned nodes (devices) and logically-positioned objects (service clouds) that are positioned by automatic graph layout. Nodes (map markers) are rendered with data-driven status badges and text labels.
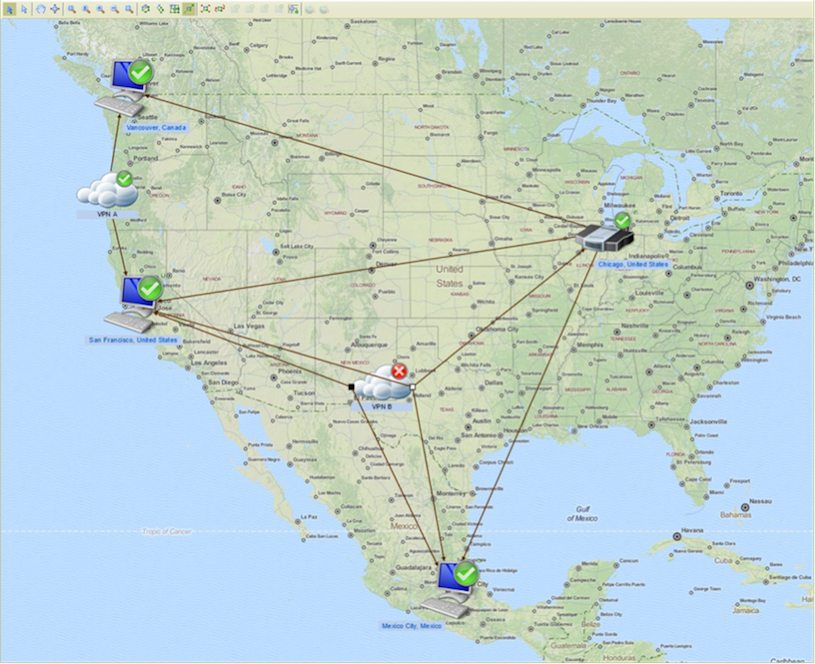
Figure 2. Simple map view with connectors that are used for incoming edge grouping.
Spatial Data Visualization with Partial Geographic Information
Datasets typically contain a mixture of geographically-positioned objects and logical objects without meaningful geographic locations. With our new geographic drawing view, you can put all objects in the same drawing and configure which objects should be positioned by their geographical locations and which ones are arranged by our automatic graph layout engine.
For edges, you can choose whether to position them geographically to show their exact route on the map, or you can draw them as logical connections between nodes.
This powerful approach allows you to take advantage of our advanced, automatic graph layout capabilities to select the best positions for logical objects with respect to the geographically-positioned objects.
Mix Geographical and Logical Data
Geographical drawing views provide the ability to create an unlimited number of nesting levels with an unlimited and independently-configurable mixture of geographical and logical views.
For example, you can define a logical outer view with geographical child drawings, nest a geographical view inside another geographical view, and nest a logical view inside a geographical view. This approach saves screen real estate, saves users time when scrolling and zooming in and out, and allows users to see multiple levels of detail simultaneously. The following examples illustrate some of the possibilities of this flexible and powerful technology.
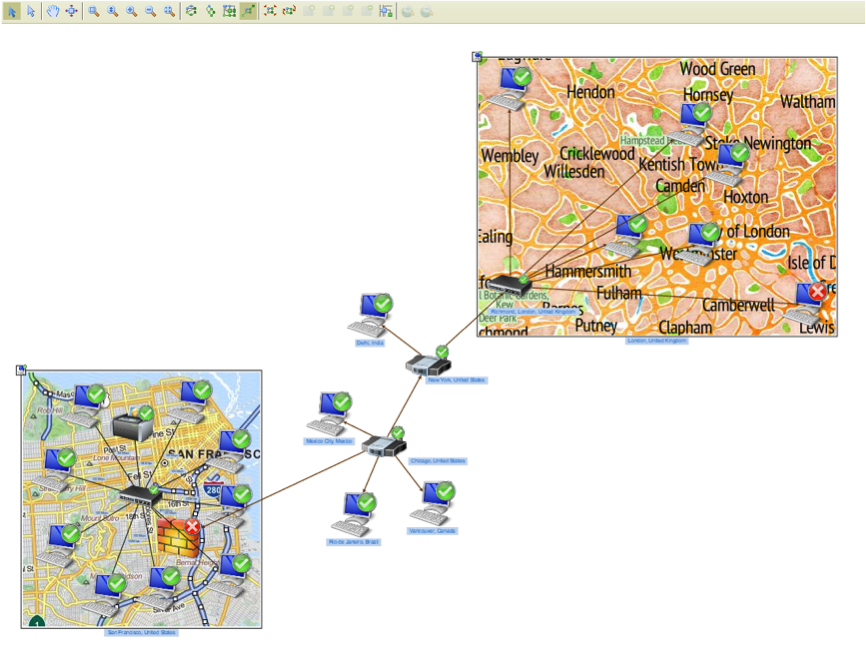
Figure 3. A nested drawing with a logical parent drawing (outer level) and geographical child drawings (inner level). Each drawing in the nesting hierarchy can be independently configured to be either a logical drawing or a geographical drawing with independently selected map provider.
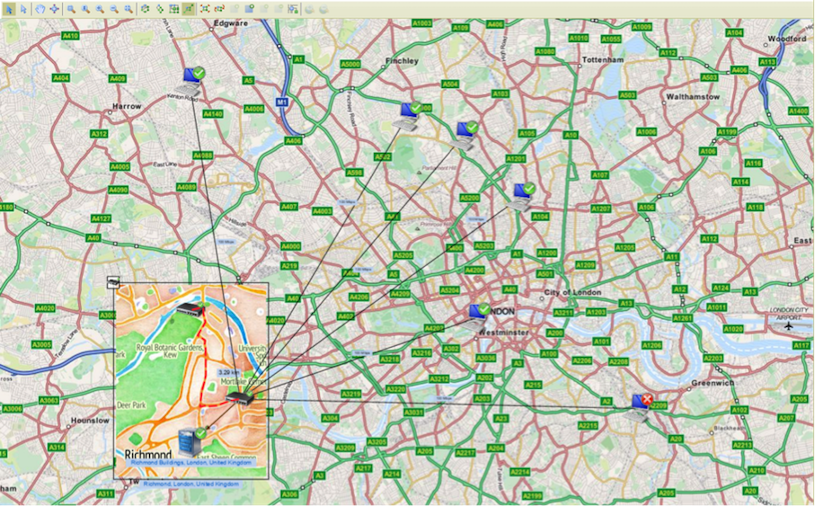
Figure 4. A geographical view nested within another geographical view.
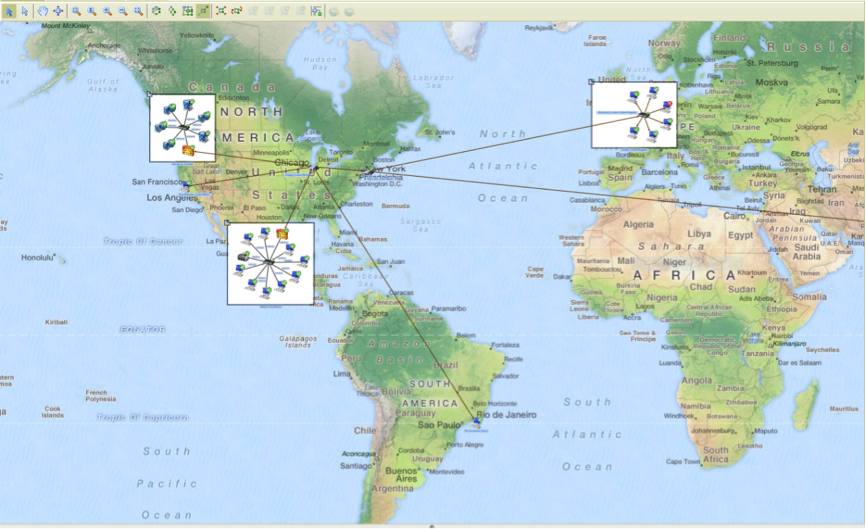
Figure 5. Logical network views nested within a geographical view of the buildings in which they are located. This visualization is convenient for visualizing networks between buildings, and also networks within each building. Buildings are positioned in geographically-correct positions, but devices which share the same geographic location are positioned considering only their network topology.
For More Information
Visit www.tomsawyer.com to view our other demonstrations, sign up for a product evaluation and get the latest product release information.
Tom Sawyer Software is a Gold Sponsor of GraphConnect Europe. Click below to register for GraphConnect and meet the rest of the Tom Sawyer team in London on 26 April 2016.
Share Article


Explore
Related Articles


Top 10 Graph Database Use Cases (With Real-World Case Studies)

15 Best Graph Visualization Tools for Your Neo4j Graph Database