NLP at scale for maintenance and supply chain management

Senior Data Scientist, Caterpillar Inc.
19 min read
Editor’s Note: This presentation was given by Ryan Chandler at GraphConnect New York in October 2017.
Presentation summary
Caterpillar is a 90-year-old company that manufactures large industrial machinery, including some autonomous vehicles. For the last decade, the company has been exploring natural language processing (NLP) for purposes such as vehicle maintenance and supply chain management.
NLP is, in essence, a computer’s ability to understand human language as it is written. As we parse sentences, it becomes clear that graphs are a natural representation of language – largely because graphs provide the lowest level of structure with the highest degree of flexibility.
Through a variety of use cases, we explore the best ways to interact with a machine through dialog (which includes expanding the structure of the graph to include verbs and nouns, as well as the relationships between them) and how to apply this concept at mind-blowing scale. And by exploring a film-related dataset through virtual reality, we can physically see how our data is organized as we increasingly refine our model.
Full presentation: NLP at scale for maintenance and supply chain management
I want to discuss natural language processing (NLP) at scale for maintenance, but what this blog actually delivers is something much more exciting: natural language processing at a mind-exploding scale.
I work for Caterpillar, a high-tech company that does things like manufacture large industrial machinery, including autonomous vehicles, generate power and mine resources. My role at Caterpillar as a senior data scientist is becoming increasingly focused on capturing knowledge and storing it in a graph database. I’m also a PhD student in cognitive and linguistic informatics, and work at a satellite location in a small lab at the University of Illinois with undergraduate and graduate students.
NLP, AI and graph databases
Why would Caterpillar even be interested in natural language processing? It might seem like a far leap, especially for supply chain management. But let’s take a look at a video from GE back in 2012, which shows the crossover between what they and Caterpillar is doing:
I agree that analytics makes this possible. The topic of natural language dialog between people and machines is probably going to be analytics, and the mechanism to make that happen is natural language processing. Graph databases make this possible because they have a very natural fit with language processing.
Many people will tell you that 80 percent of data is unstructured text, which is based on a study released about 15 years ago. But, as I mentioned, I’m a contrarian and wanted to find out if that number was actually real. A dissenting opinion from Phil Russom at TDWI says that only a little over half of the data at an organization is unstructured, which includes things like sensor data and telemetry in addition to text. There is also a significant amount of knowledge stored in things like social media and internet pages, which we would like to tap into as well.
Artificial intelligence also lends itself naturally to graphs, because they can facilitate the ontologies and knowledge representations that have been around for a long time.
Alfred Korzybski, the founder of “general semantics,” is known for saying, “The map is not the territory. If the words are not the things – meaning they are just representations of things – and the maps are not the actual territory, then obviously the only possible link between the objective world and the linguistic world is found in structure and structure alone.”
Graph is the lowest level of structure and it gives us massive flexibility. I won’t give you a full linguistics lesson, but I will discuss a couple schools of thought regarding language processing. Often when we do language processing we’re broken down either into dependency structures – which looks at the verb and draws arcs from the verb to the relationship of the other words relative to the verb – or it breaks down into a constituency tree.
Below is our binary tree, and you can see how these are amenable to graph representation:
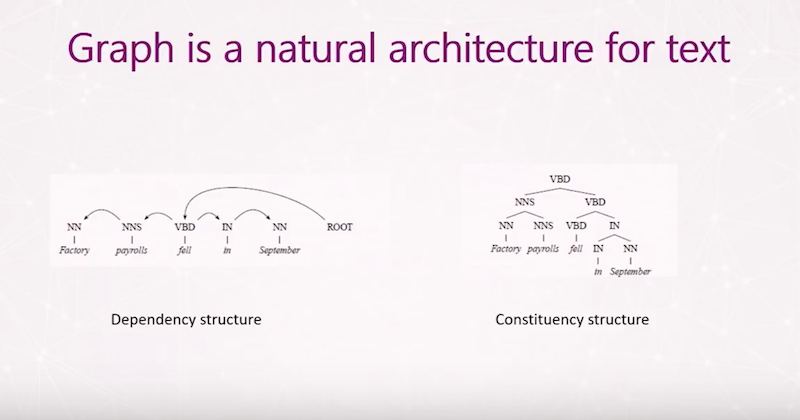
These are graphs, right? One of the overriding principles here is that we parse, and we parse that into graph.
I’ll describe two use cases for you and hopefully you’ll be able to see a progression of sophistication as we move from some sample to real world examples, and how – through trial and error – we continue restructuring and figuring out the right way to parse, at least for our uses.
Use case 1: Dialog system
This example ties back to Bill’s GE talk in which he says that in the future, we’ll be able to talk to the machine. We wanted to see if we could develop a small example of how we might interact with a machine through dialog.
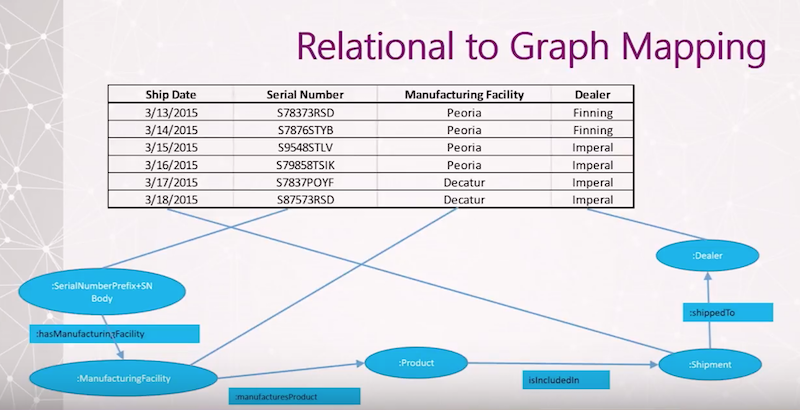
Executives often ask us for reports, so we asked for some data we could use for a dialog system. Below is what they gave us:
In the area of business intelligence, people often say that no matter what type of report you give somebody, there’s always a resulting report to meet the needs of another person or department.
We wanted to create a system that would allow someone to ask any type of question as long as it’s in the domain. This meant creating a dialog system to test the use of a graph, demonstrate an open-ended user interface capable of answering questions, and to develop a capability to create spoken human machine interface.
When you look at this, you see that we have a manufacturing facility, and a manufacturer’s part as a relationship to a product. These concern factory shipments and thus you would be able to ask a system like this, “How many trucks did we manufacturer in Decatur and ship to Asia?”
This is just a fragment of the larger ontology – the larger graph model – we expanded into. And as before, you saw that the products are attached to a manufacturing facility:
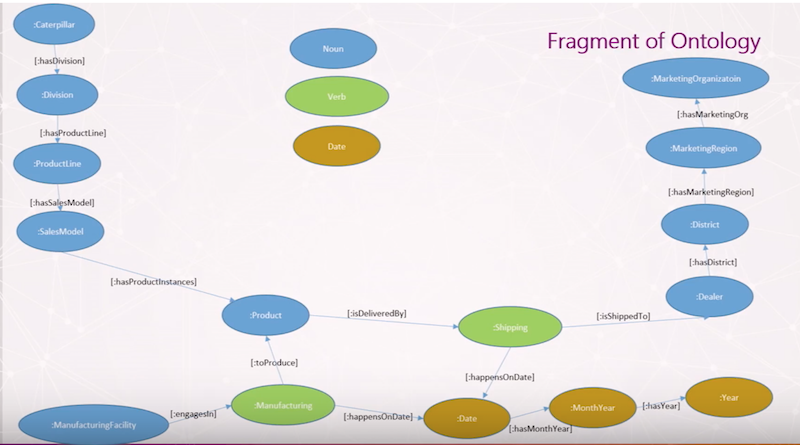
Here, we intermediate that relationship with a manufacturing function. You can think of the blue ovals as nouns and green ovals as verbs, and by teasing apart this information in a linguistic fashion, we end up with something very readable. We can say that a product has a sales model, and a manufacturing facility produces a product that is delivered via shipping to a dealer.
Using a model like this, you might ask the question, “How many of a certain type of product did we ship from this division to this district?” The nodes wouldn’t necessarily have to be adjacent. They might even have a variable number of intermediary nodes that mediate between them.
Ninety-eight percent of dialog systems consist of a knowledge representation, which in this case is the Neo4j graph. The other part of this system is a query interpreter:
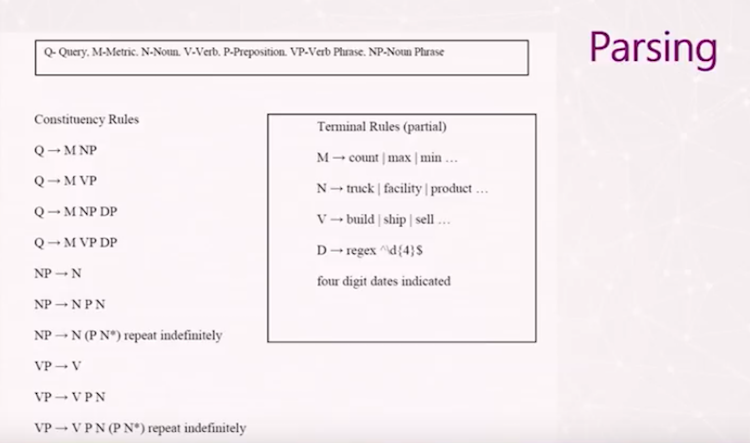
The query interpreter determines whether or not a query is well-formed, which is exactly what the above constituency rules of grammar show. A query can be formed by putting a metric with a noun phrase.
For example, if you just ask “how many trucks do we have?”, it would give you the number of trucks that have ever been in the system across all facilities – which doesn’t provide very meaningful information.
But this interpreter structures the types of queries you’re able to ask. When we bring a phrase in, we look for these words (or metrics). For example, if the query asks for counts, minimum or max, that’s a metric. If it’s asking for nouns, we make that a noun, verb and then regular expressions that might match dates.
So if you want to ask the query, “How many trucks were manufactured on this date?” you have an infinite number of responses that can be generated. You could instead ask, “How many trucks were made in Decatur and shipped to Asia? How many were built in Peoria and shipped somewhere else?” Thus, you can repeat those queries indefinitely and create any number of generative strings.
But we didn’t want to simply have the knowledge representation and use the graph to instantiate that. We wanted to make as much of the application as possible in graph.
Below is the query processing model we developed for our graph:
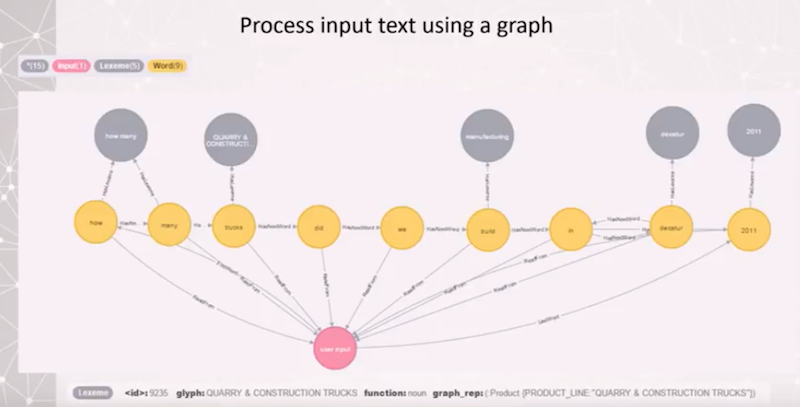
User input occurs at the bottom, represented by the red node, and the words are stored as yellow nodes. From the interpreter’s perspective, it’s only those things which are in gray that link to our lexicon or database of known entities.
We’ve also come up with a way to deal with synonyms. You can see that “build,” links to “manufacturing,” for example. We route all those synonyms to one canonical definition of what those words mean to ensure consistency. Those, if you remember from the graph model, link directly to parts of that graph.
Now let’s look at a specific glyph (described at the bottom of the slide) that refers to the grey node “quarry and construction trucks.” It’s function is listed as a noun, and it has a specific graph_rep that shows you exactly where to find that node in the graph. The system reads that in and finds the appropriate node.
Below is the code that maps those given grammerical expressions or patterns to the graph query:
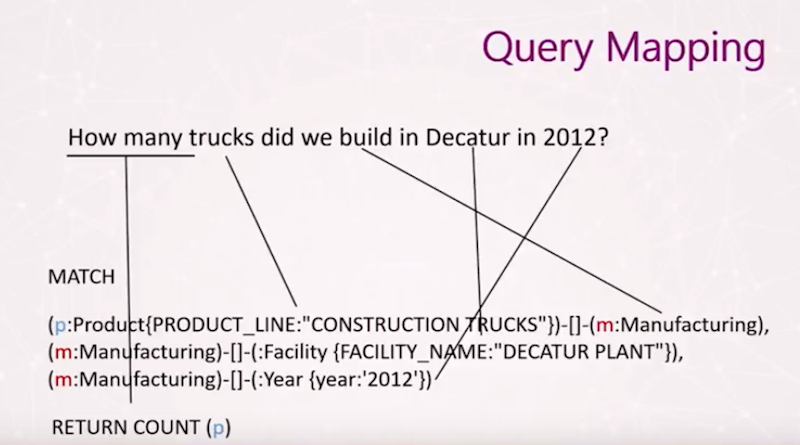
We have a front end that interprets the query and a back end that provides the data. Here you simply see that we have a Return Count, which refers to “How many” trucks we built in Decatur. We’re linking through the verb, and the dependency parse emphasizes that the verb is the most important element in the sentence because it contains the action.
Thus, we use the verb manufacturing again and again to link those parts of the fragment, or sub-graphs, together. And once you traverse all the sub-graphs, you get your constrained result representing the number of items.
This is what our interface looks like:
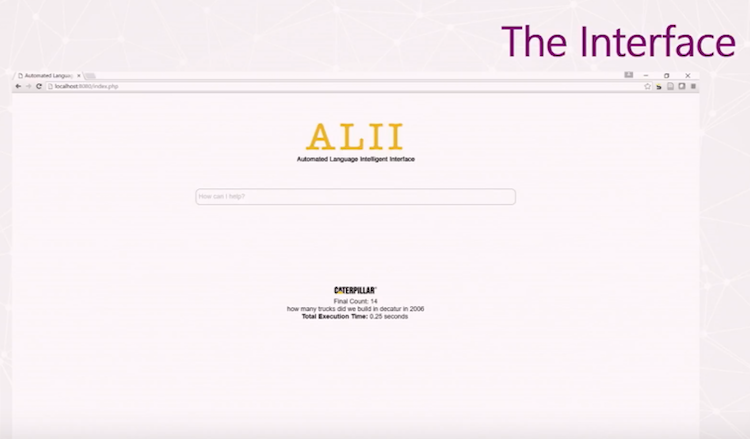
For our purposes, we have people type in their query, but you could use a speech-to-text API, like Google’s, to do this with voice. You can see the response to “How many trucks did we build in Decatur in 2006?” comes back as a Final Count of 14, which was returned in a quarter of a second.
We’re only looking at a fairly small database set, only 100,000 lines or so, but because of the scalable nature of graph databases, we believe that even with a much larger dataset we will continue to have high performance.
Let’s go over a quick recap of what we just learned:

We learned that we had to expand the structure of the graph to include verbs and nouns, as well as the relationships between them, to make the graph more readable. When we expanded that relationship that said “manufacture” and made it a proper node, this could have relationships with other nodes, like “when did the manufacturing occur?”
If you look closely, you would’ve seen that there was actually a date hierarchy that showed what year, what month-year, and what date those were manufactured, for aggregation purposes.
Again, there were variable links between any one of those nodes that represented “manufacturing” and “products.” You can see the three different Cypher queries at the bottom of this slide. We went from just looking at things that had to be adjacent to, “Hey, let’s make them variable by putting asterisks in there.” But when you make everything variable, you have a combinatorial explosion that causes query performance to go way down because you’re looking at every possible combination.
So we had the system look at the overall schema of the graph, and when it found those objects of interest based on the dialog, it mapped that entire path. Then we can issue the precise path with the precise directionality on those nodes so that, again, the query comes back almost instantly.
Use case #2: Reading warranty documents at scale
The first use case I showed you was a simple dialog to get information back from the graph database, while this use case is about reading warranty documents – which brings us to the mind-exploding scale portion I mentioned earlier.
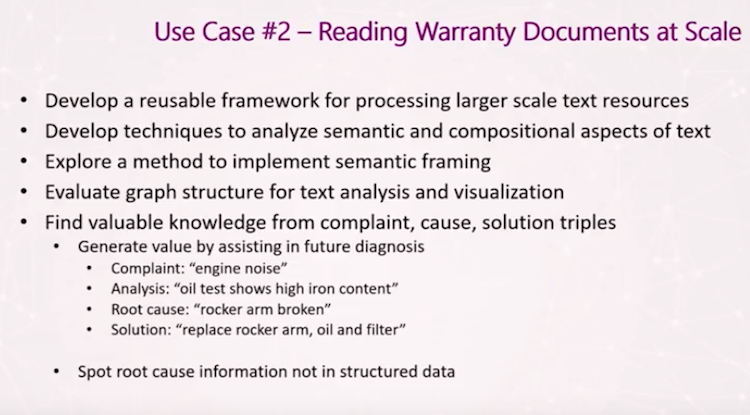
I try not to oversell this, but the code that we’re going to develop over the next few years will allow us to read documents at scale and instantiate human knowledge in text. If we can read at scale for meaning, that will be an extremely powerful technology.
So how do we do this?
We’re going to look through a data set of warranty documents, which are recorded when someone brings in a vehicle for maintenance. The technician writes down the customer complaint, which in this case in engine noise, and conducts an analysis of the problem, which is an oil test that shows high iron content. The root cause was found to be a broken rocker arm, and a solution was implemented.
This is what the data looked when we got it wrong:
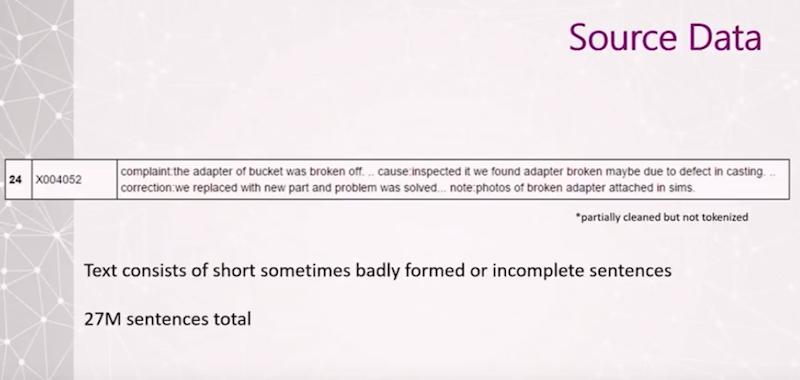
It looks like a relational database where we have all these strings. We have a complaint, which is that the adapter of the bucket was broken off, and the cause. But these are all together rather than in separate rows, so we had to figure out how to break them up.
Typically as a linguist, you don’t end up with data that is tagged or annotated like this. However, this has 27 million annotations as part of a huge, very focused data set – another critical factor. It’s extremely difficult to have open reasoning across text, so if you can really constrain it, words have far fewer synonyms and you probably know what they mean.
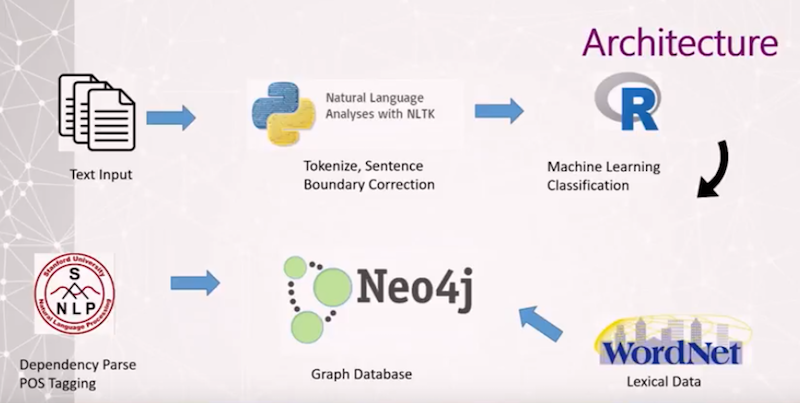
Below is what our data architecture looks like:
We simply create a pipeline which ingests text via an open-source, freely available tool called the Natural Language Toolkit, which uses Python to chunk those sentences into a big string of sentences, corrects the boundaries, and gets rid of garbage in the text. We do a little bit of machine learning classification, and issue a “dependency parse.”
Again, that was that flat one at the beginning that didn’t break down into constituency trees, it just had the verb and connections between the verb. We thought it would be more robust to include badly formed, short sentences so that we wouldn’t be thrown off by missing information.
We brought all of that into the Neo4j database and added some WordNet, which is an electronic dictionary that has all the definitions for a given word, called a lexicographic dictionary or database.
Why did we incorporate machine learning classification?
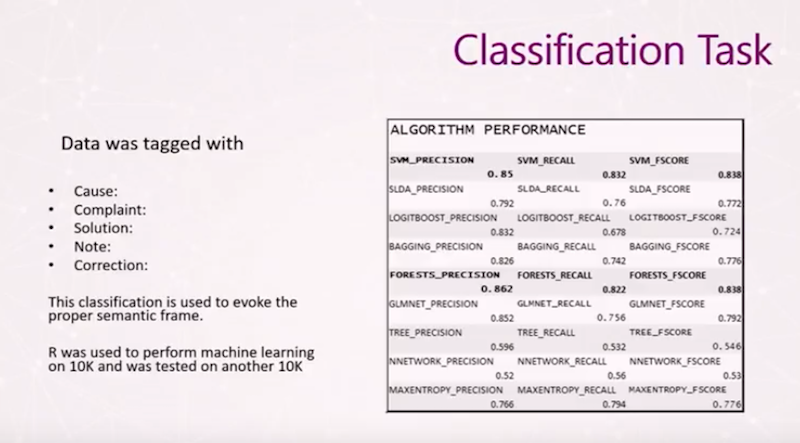
Half of the items were tagged as the complaint, the cause, and the solution, which provides a great resource to train a machine learning algorithm to tag the other half. That’s exactly what we did here, and we ended up with fairly decent results. This is an F score, so it’s both precision and recall, and we got better results because we combined solution and correction. We were able to tag everything as a result.
This is what the parse looks like:

We use the open-source, freely-available Stanford Parser to parse the documents. In this particular case, the adapter of the bucket was broken off. If you do a naive keyword search, you might simply look for the word “broken” next to parts identified as components, and when you find them, you know they’re associated because the words are close together.
But in this case you can see that in fact the bucket wasn’t broken, the adapter of the bucket was broken. The “nsubjpass” relationship here relates those two – that’s a nominal subject passive between the verb and that word. We can study all the problem words and component words to see which type of relationships can be found between those two words, and better understand what we should be looking for.
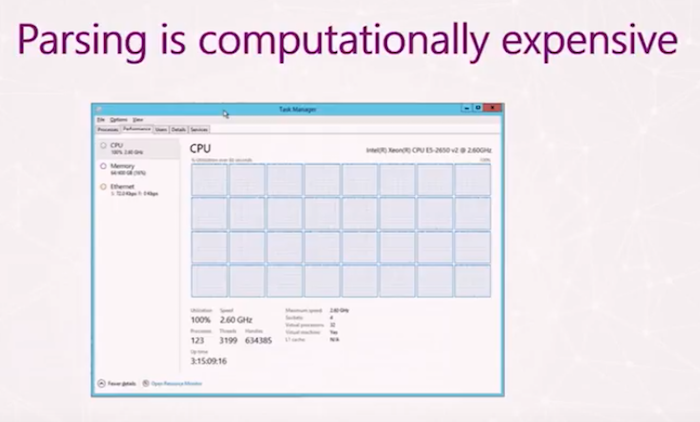
Parsing is computationally expensive. A probabilistic, context-free parser looks at lots of examples and does a statistics-based approach on how to properly break down that sentence. This is 32 logical processors running on a machine, and even though we could run a 100,000 lines through this a day, it’s still a lot of time when you have 27 million.
So why are we doing this in graph?
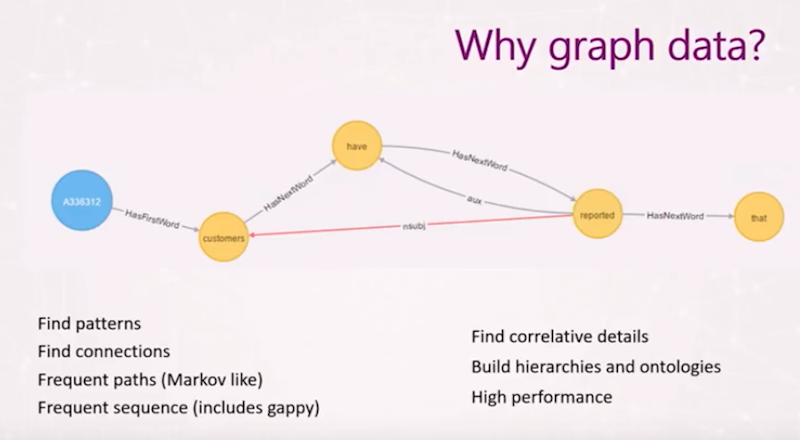
We use graph so that we can find patterns and connections, and build hierarchies and ontologies. And this is simply those parsers as a graph.
You can imagine that when we run 27 million documents through our database, build a graph, and look at it in the default Neo4j browser, it quickly becomes hard to deal with. At first, we created a node for each document, and every time we see a sentence in a claim, we’re going to create a trace – or parse – through all of those nodes. That way we wouldn’t be recreating the same nodes over and over and over.
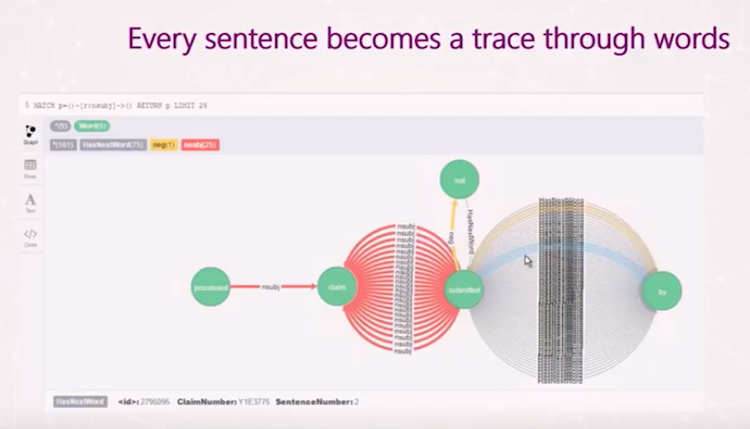
This is problematic because if I was to try to do a search on a claim number, you can’t index relationships out-of-the-box. You can index the properties of nodes or implement APOC, but it still didn’t perform very well.
Ultimately we corrected this using the following model:
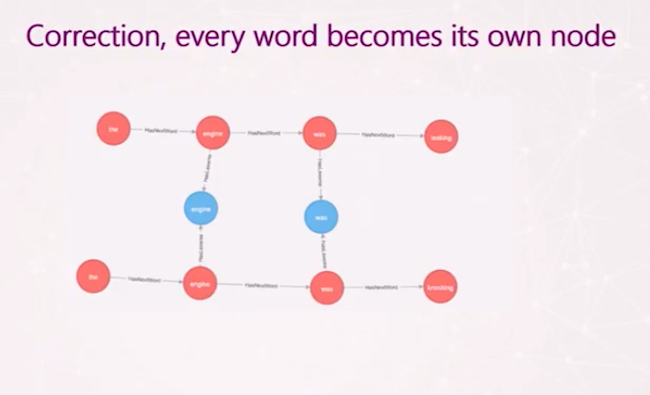
Each series of red nodes is a sentence, and each word is related to the other words in the sentence with “hasnextword.” Note that you can’t see the parsing structure in this slide, that’s hidden.
But now any time the word “engine” is used – shown in the blue nodes – it links to another golden record, the one that’s stored in the dictionary. Then if I still want to look at anything connected to engine, I can just show it this pattern. And those nodes are pretty cheap.
Another aspect of implementing is instantiating knowledge as a structure:
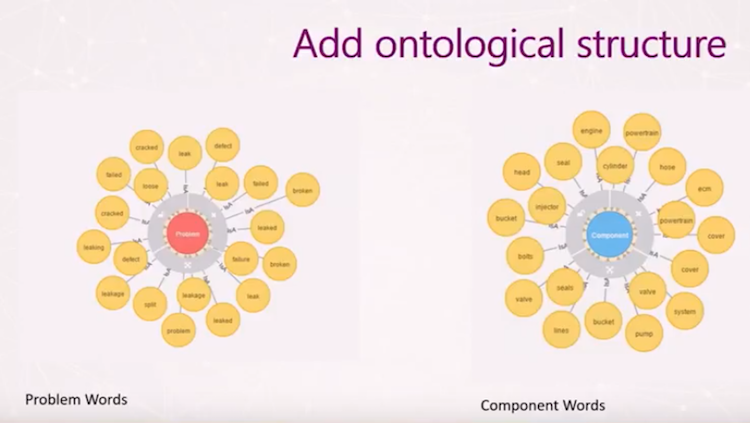
This is a very simple, ontological, super-class/sub-class relationship.
The yellow node reads “component” and all the yellow nodes attached to that are components, such as a pump, powertrain and engine. The red node reads “problem” and all the yellow nodes attached to it indicate a problem, such as a leak. We just looked at high-frequency words to quickly build these graphs.
This ontology provides the structure to create the following simple Cypher query:
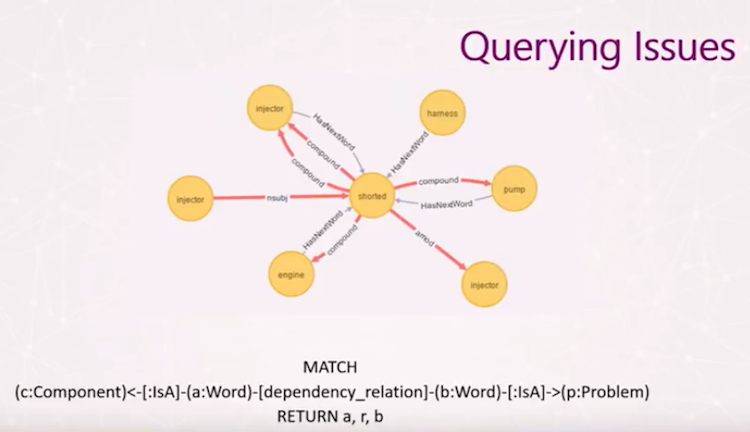
This allows you to take millions of documents, parse them, create a very shallow ontology, and then create this trace-through that gives you meaning. This allows you to extract meaning at scale from these text documents.
Semantic frames
Up until this point we have concentrated on low-level, small example of tracing through a sentence. Now we’re going to shift of the topic of semantic frames:
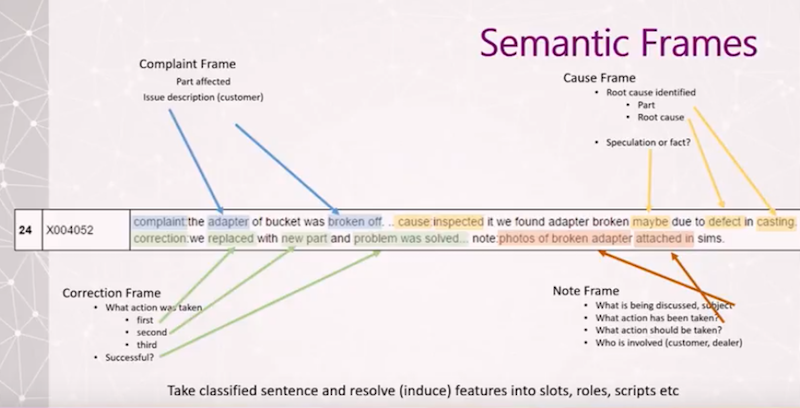
In the 1960s and 1970s, Marvin Minsky and Charles Fillmore created this idea called semantic frames. In short, what it means is that a lot of what is understood via communication in words is not literally communicated. If I say, “I went and bought a DVD last night,” you know that I might have gotten into a car, gone to a retail location, and used some form of payment to pick up the DVD. This is all background information that’s tied to us cognitively. Ultimately, semantic frames represent a slot-filling system.
Remember, earlier we classified those sentences. And if we know what they were, we can fill in those slots, or expectations, about what else is going to be present. If I know that if I see a complaint I should also see a part and a problem, if I don’t find all of those components mentioned, I might need to start looking at some additional sentences. And as you start setting these expectations, it allows you to get more and more through inference and deduction.
In conclusion: A virtual reality graph exploration
To recap what we’ve gone over so far, I’d like to emphasize again that structure is critical. The most important thing is how you set up your structure.
We made each instance of a word a node and then connected it to a golden version of that word. And as I mentioned, we found out that it was difficult to view these graphs in the default Neo4j browser because they were so large. We said, “Okay, well, it’s hard to view tens of thousands, hundreds of thousands of nodes. Can we do this in VR somehow?”
For this VR demonstration, we’re relying on a large online database with actors and movies. I think there are about 27,000 total entries, but I’m only going to show around 1,000 that I’ve randomly placed on two separate planes: actors on one plane, movies on the other. I created connections between the planes using Oculus Rift, and developed it in the Unity game engine.
We are currently working on a project with the National Center for Super Computing Applications – the group that invented the web browser – to develop a visualization of text documents at scale.
How could we build something that would allow us to browse semantics and meaning at a large scale? We are also working to develop a more complete theoretical foundation to build knowledge structures in graph based on constituency parsing and formal semantics.
Share Article


Explore
Related Articles
Neo4j Named “One to Watch” in Snowflake’s 2026 Modern Marketing Data Stack Report

Zero-Copy Graph Reasoning on Snowflake: Getting Started With Neo4j Virtual Graph

