Predict Information System Incidents with Neo4j [GraphConnect Recap]

Senior Field Engineer, Neo4j
5 min read
Editor’s Note: Last May at GraphConnect Europe, Nicolas Rouyer – Senior IT Architect at Orange – gave this valuable talk on tracking and predicting information system (IS) incidents using Neo4j. Listen to or read his presentation below.
Register for GraphConnect San Francisco to hear more speakers like Nicolas present on the emerging world of graph database technologies.
Today we’re going to explore information system (IS) supervision with graph databases.
At Orange, we have a huge IT system, so we needed a strong information system supervision framework to see important patterns emerge such as network bandwidth, storage input, output and so on. In addition, we needed to see when network incidents occur, where they are located, how we can solve them and – most importantly – how to predict them.
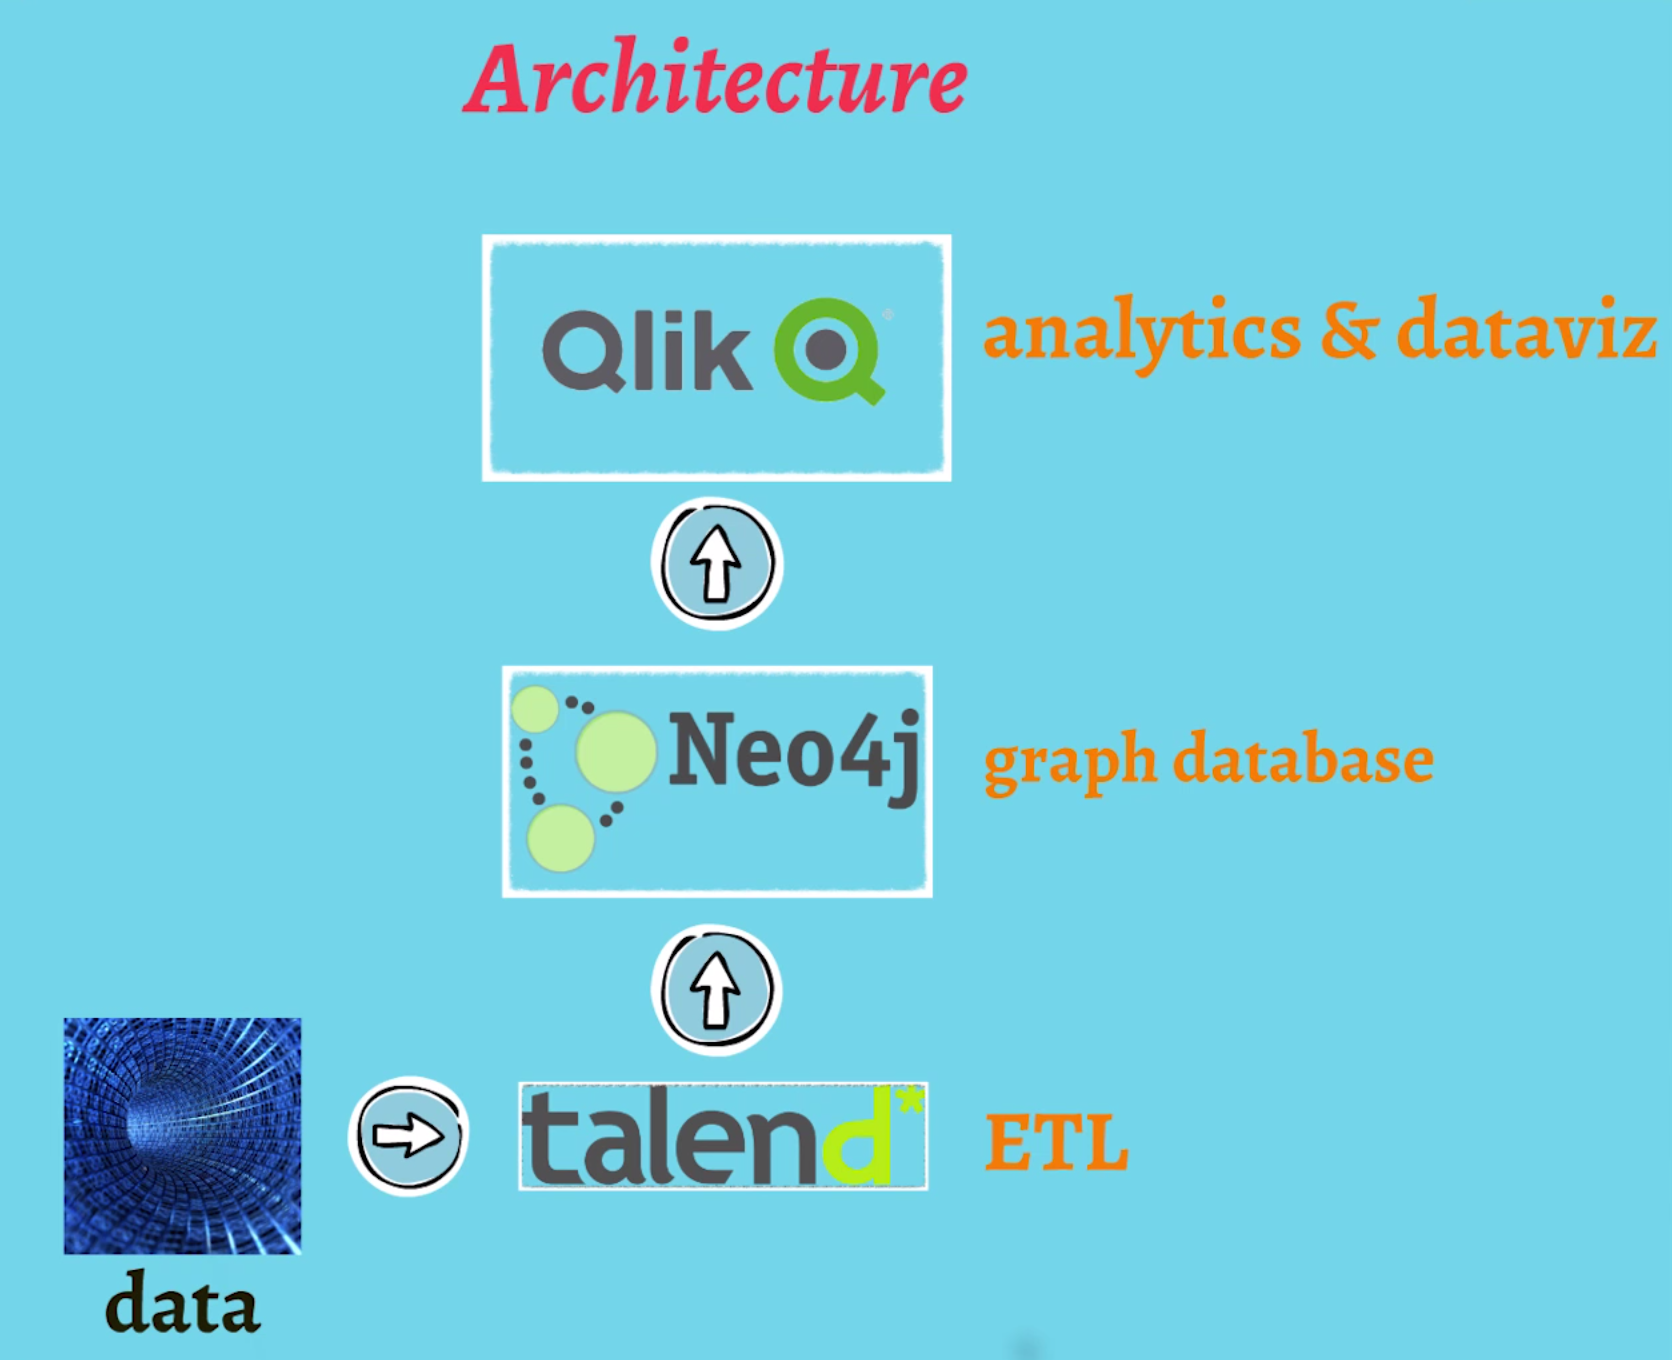
In terms of architecture, we built our system around integration (see diagram below). We used Talend to load our data, Neo4j to model our IT data model and a QlikView dashboard.

Our Quest: Find Anti-Patterns in the System
One particular purpose of our information system supervision initiative was to find anti-patterns in our IT systems.
Anti-patterns can be applications that flow data together before bringing it back to the initial application. Or, anti-patterns can be ‘spaghetti plates’ with many-to-many connections between applications where it would be better to put an enterprise service bus (ESB) between those applications.
To find these anti-patterns in our information systems, we knew we needed a graph topology. Using our integrated approach with Neo4j, we were able to detect and isolate anti-patterns in the graph. Here’s how we did it.
Our Information System Supervision Data Model
As far as information systems provisioning is concerned, we knew we could build very complex data models, but we decided to start simply. The model below is our first draft.

The first nodes we designed were our applications, and the first relationships we designed were any relevant :FLOWS relationships. The second major set of nodes we created were the incidents experienced by each application. So in basic Cypher, that is:
(application) - [:HAS] - > (incident)
Semantically, that’s not very complicated, but this was only the beginning of our data model. We then decided to enrich our data model with various properties on relationships and nodes.

In this model, we can precisely tell if any given application is a production application or a development or integration application. We also have insights from flows because flows can be FTP, SQL and so on, and we can make bandwidth inquiries on flows as well.
After we enriched the simple data model with properties, we then asked: How can we predict incidents in our information system?
Graphing Time to Predict Incidents
In trying to predict incidents in our information systems supervision framework, I reached out to Neo4j for support. I distinctly remember when Stefan Armbruster at Neo Technology encouraged me to build a graph of the timeline of all our incidents. At the time, it was daunting, but we did it anyway.
We started by building connections between the days where incidents occurred. You can see this in the model above with the nodes ‘Day 31’, ‘Day 01’, ‘Day 02’, etc.
To walk through an example, we can see that an incident occurred with Application 1 on the 31st. We can also see that Application 1 flows into Application 2. Even before another incident is signaled in the information system, we can query the database to find all of the other applications that exchange flows with Application 1. We can then predict – and proactively prevent – any related incidents from occurring in Application 2 as a result of the first incident.
This is a unique approach because usually information system supervision is made on an application-by-application basis. IS professionals don’t typically analyze chain reactions, but with just a few simple Cypher queries, we can do just that and find the next best actions information supervisors and operators should take in order to prevent future incidents.
(Watch the video above to see Nicolas execute an example Cypher query.)
Graph Advantages for Agile Project Management
Another major advantage of using a graph database model in our information system supervision framework was project agility.
As IT professionals, we often want to change our minds during projects so the data model must change frequently. With a graph database model, if I want to add other properties to my nodes, I can do it on the fly.
The market is another major factor: Our customers often want a proof of concept before being convinced that they’ll use a new solution, so we need to build (and evolve) a data model rapidly to produce proof-of-concept solutions.
Also, in terms of risk management, we have many other projects that undergo other rounds of revisions, and if we spent all our time refining a given data model and discussing which model best described reality, we would spend far less time rebuilding our solution every day.
Final Reflections: Data Enrichment
I think there is a major point to be made around data enrichment and graphs. The data model we currently use at Orange for information system supervision is perfectly adequate, but it’s our third attempt.
After our second attempt, we found our referential data to be a nightmare because 70 percent incidents weren’t being correctly linked to the application where they occurred. In fact, it was by ingesting our real data into Neo4j that we discovered this discrepancy.
With an old relational database, we would have had to go back to the drawing board and recreate an entirely new data model. However, with a graph approach, we were able to overlay our data from network probes and incident application with our initial referential data.
The question is: When do you gauge your predictive model is accurate enough? We needed enough real data to enrich the predictive model and divide data into two subsets: one to train the predictive model, and the other to check model accuracy. The result was a fantastic – and flexible – new model that did exactly what we needed.
In conclusion, I’d like to note that not all use cases for graph databases have to come top-down from market leaders. Sometimes a bottom-up approach can be just as effective. I found just a few while searching for anti-patterns and ‘spaghetti plates’ but I believe that when we get started with real data in Neo4j and dig into the results, we can produce many, many more use cases.
Inspired by Nicolas’ talk? Click below to register for GraphConnect San Francisco on October 21, 2015 at Pier 27 to learn more about the emerging world of graph databases — from enterprise customer stories to hands-on training and workshops.
Share Article


Explore
Related Articles

Top 10 Graph Database Use Cases (With Real-World Case Studies)
How to Graph an ERP System in 3 Easy Steps

Graphs for Information Services: The 5-Minute Interview With Cyndi Streun

Top 10 Use Cases: Empowering Network and IT Operations Management
Lean Graph Data Models Drive Fast Innovation: A Fireside Chat with David Fox, Senior Software Engineer at Adobe