Predictive modeling techniques: Types, benefits & algorithms

AI Research Engineer, Neo4j
16 min read
With the immense amount of data being generated daily, organizations are drawn to advanced analytics, data science, machine learning, and AI to drive better forecasting, more accurate predictions, and truly novel innovations.
But many businesses fail to reap these benefits. Instead, they often fund, staff, and launch data science projects without first establishing clear, measurable goals or building properly fitted teams. It’s a costly, time-consuming, and fruitless approach that leaves much to be desired in terms of making any meaningful business improvements.
So why do so many teams struggle to get it right? To identify what’s important, what’s unusual, and what’s next, data scientists need access to the right data in the right format and the ability to present that data in a meaningful way to stakeholders. But they’re faced with the enormous challenge of determining how and where to find the best data for each project, and how to best support broader business problems using the right data science approach. This makes it difficult to meet expectations to move projects into production – and ultimately hinders their decision-making.
Engines that use powerful graph technology can help overcome these obstacles as they bring together more comprehensive domain knowledge, improved analytics for more informed decision-making, and provide new sources for ML feature engineering. In fact, data scientists who use graph data science for their predictive modeling can improve the technology and workflows for thier target user’s projects quickly and seamlessly.
Here, we’ll take a deep dive into all things predictive modeling, including its benefits, common tasks and algorithms, potential challenges, and how the right algorithms (backed by the right technology) can help.
What is predictive modeling?
Before we get into the nitty-gritty, let’s define predictive modeling and take a look at how businesses in different spaces might use it to their advantage.
Predictive modeling is the process of inputting data and analyzing patterns within that data to predict future outcomes. It’s crucial to note that while the two terms are often conflated, predictive modeling and predictive analytics are two distinct ideas. While predictive modeling utilizes data-backed algorithms to make predictions, predictive analytics refers to the application of those predictions – typically for stronger, more informed business decisions.
While predictive modeling isn’t a new practice, it has become increasingly vital to the success of today’s businesses. As the global marketplace expands, customer expectations rise, and organizations in every industry must do more with less, predictive modeling has become essential for a healthy operation.
This is especially true in the wake of the COVID-19 pandemic, wherein decreased demand, volatile market conditions, and unforeseen business disruptions threatened the viability of many companies. As a result, leaders have realized that predictive modeling based solely on historical data is no longer enough to garner accurate predictions that bolster informed business decisions. They must also look at a high volume of connected data (from both internal and external sources) to gain a more complete picture of future outcomes.

Every area of a business can derive value from predictive modeling. Using robust algorithms, team members across each department can get answers to their most pressing questions. Marketing teams can identify when to send the next email and what the body should include for the most positive response; product teams can determine what to build next; HR can establish what type of training will be most beneficial at each point in an employee’s career; and finance teams can discover the best price for products and services moving forward.
Benefits of predictive modeling
Data scientists are, of course, uniquely focused on extracting key insights, enabling the exploration of both structured and unstructured data, and building models that help them resolve business problems. Predictive modeling supports these priorities by offering some key benefits:
- The ability to incorporate external variables – Regulation, environmental factors, and uncontrollable market conditions all impact the ability to make strong technical decisions. Predictive modeling integrated these variables for more holistic, accurate predictions and – ultimately – a more strategic approach.
- Reduced time, cost, and effort to predict business outcomes – Instead of wasting time, budget, and bandwidth capturing and correcting data generated from various sources, predictive modeling helps end-users quickly and seamlessly identify patterns and predict outcomes.
5 common predictive tasks
Predictive tasks (sometimes called machine learning tasks) are based upon the relevant question or problem posed along with available data. They refer to the type of prediction that is subsequently made.
Some common predictive tasks include:
1. Regression
Regression tasks help to predict outcomes based on continuous values. It’s a supervised ML approach that uses one or more independent variables to predict target values – assuming that there is some sort of relationship that can be inferred between data inputs and outputs.
A common example of a regression task is predicting housing prices based on factors like location, number of rooms, square footage, and the year a home was built. But regression tasks are also helpful for score estimates, risk assessments, weather forecasting, and market predictions.
2. Classification
Classification is similar to regression but used for predicting categorical outcomes instead of continuous ones. In other words, helping predict the group or category an item belongs to. Just like regression, classification tasks are supervised, meaning that previously known category labels are required as a target for model training. Specific qualities, characteristics, and features are used to differentiate items, then bucket them into the appropriate group. To accurately classify items (especially at a larger scale), classification tasks can employ a diverse range of algorithms and methodologies.
Businesses use classification tasks to identify spam emails, detect fraud, classify images, and even help diagnose illnesses.
3. Anomaly detection
In today’s world, the Internet of Things (IoT) offers greater connectedness across countless software, sensors, and technology. This is extremely advantageous for businesses across nearly every industry, especially those that use anomaly detection tasks to identify, prevent, and ameliorate issues before they become larger problems.
Anomaly detection tasks identify out-of-the-ordinary instances, behaviors, and patterns that might otherwise fall through the cracks. They’re particularly helpful for alerting maintenance teams of unusual equipment sensor data, enabling fraud detection in financial data, and identifying cybersecurity threats.
4. Clustering
Clustering is similar to classification in the sense that it aims to categorize items into different groups. The big difference is that clustering is unsupervised and, as such, does not require labeled data. In other words, clustering is used to group together items when the data doesn’t already have a known categorization scheme with historically assigned values. Instead, clustering simply seeks to group together items that have similar features and separate items whose features are markedly distinct.
For this reason, businesses often use clustering to conduct market segmentation, customer segmentation, document classification, and image segmentation.
5. Similarity matching
Similarity matching aims to identify similar pairs of individuals and/or items based on related features or associated activity. Similarity matching is immensely valuable for a variety of applications, from recommendation systems to bioinformatics and entity resolution. However, similarity matching often involves comparing many pairs of objects, which entails relatively high amounts of complexity and computation. As a result, similarity matching requires a special set of approaches forming its own distinct category of predictive modeling tasks.
Similarity matching is ubiquitous in much of today’s online technology and is commonly used in customer-facing applications. Product and content recommendations are among the most popular examples of similarity matching in the real world.
7 common predictive algorithms
Accurately predicting future outcomes requires specialized computation and algorithms. This process is called machine learning and has become a staple of AI. Deep learning takes the concept to an even more sophisticated level with algorithms that are intended to mirror brain-like logic.
Each algorithm requires a different amount and mixture of real-time and historical data, but it’s important to remember that the more data available, the better. Because of this, data scientists (and the business as a whole) need unencumbered access to data from a variety of sources.
Some common predictive algorithms include the following:
1. Linear regression
Linear regression can be used to estimate and illustrate a linear relationship between an independent and dependent variable. For example, linear regression can be used to estimate the level of employee satisfaction based on salary. Using company data on both employee satisfaction and salary, an XY graph is plotted to show the relationship between the two variables. The algorithm can then predict the level of satisfaction employees will feel if they receive a certain salary.
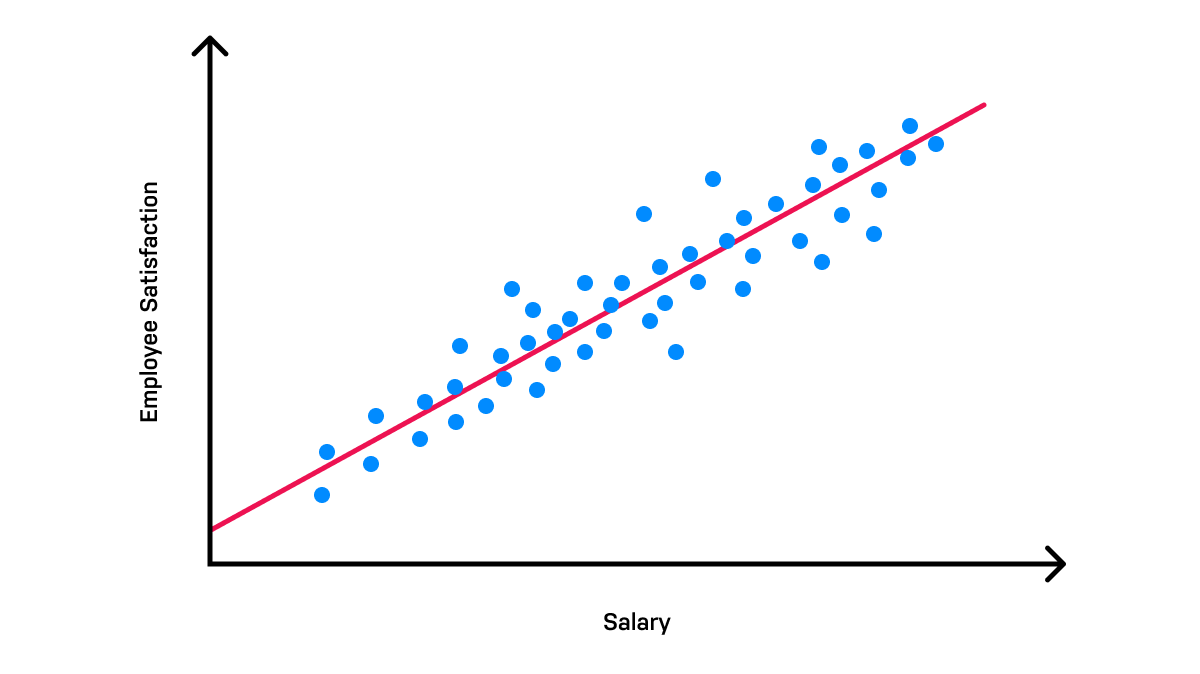
Linear regression algorithms are both simple and beneficial, as they can help businesses quickly glean insights on customer behaviors, operations, and even profitability.
2. Logistic regression
Logistic regression, despite its name, is used for classification tasks (to predict categorical outcomes based on historical data), often in the form of a binary outcome (e.g., yes or no). While the outcome is often binary, the algorithm can take into account multiple factors for input, then bucket predictions into one of two options.
For instance, logistic regression can predict if a customer is likely to buy based on their stage in the sales process, previous actions, and more. Using these insights, marketing, sales, and product teams can tweak their strategies to boost the number of purchases.
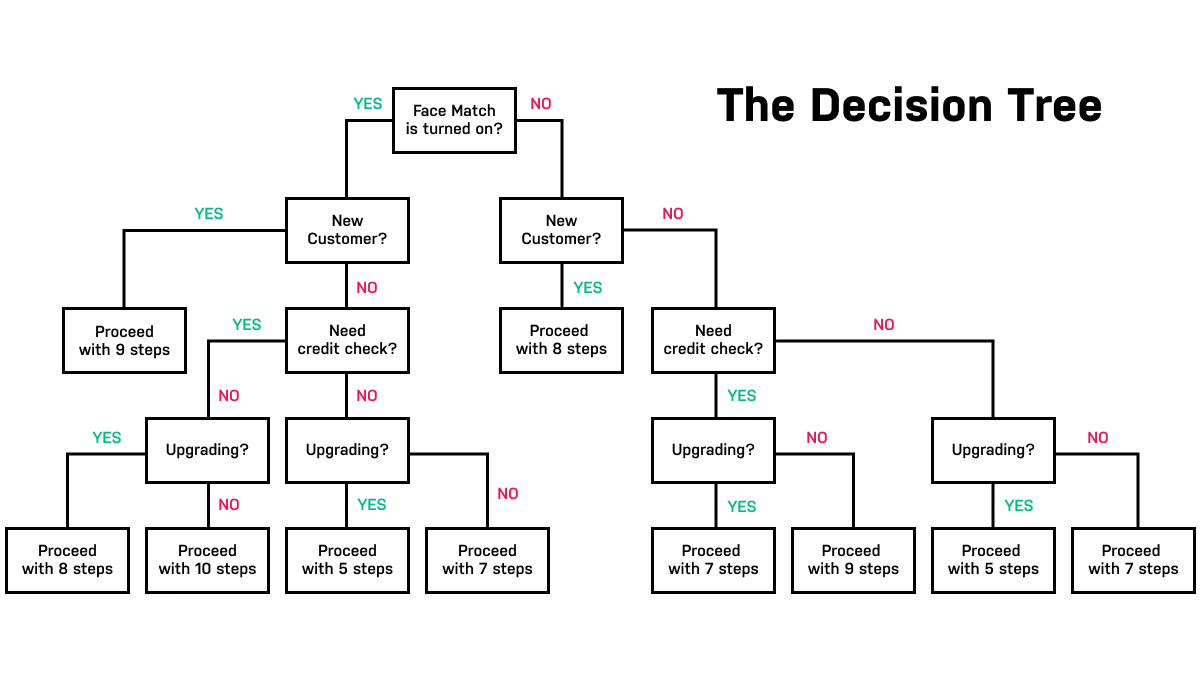
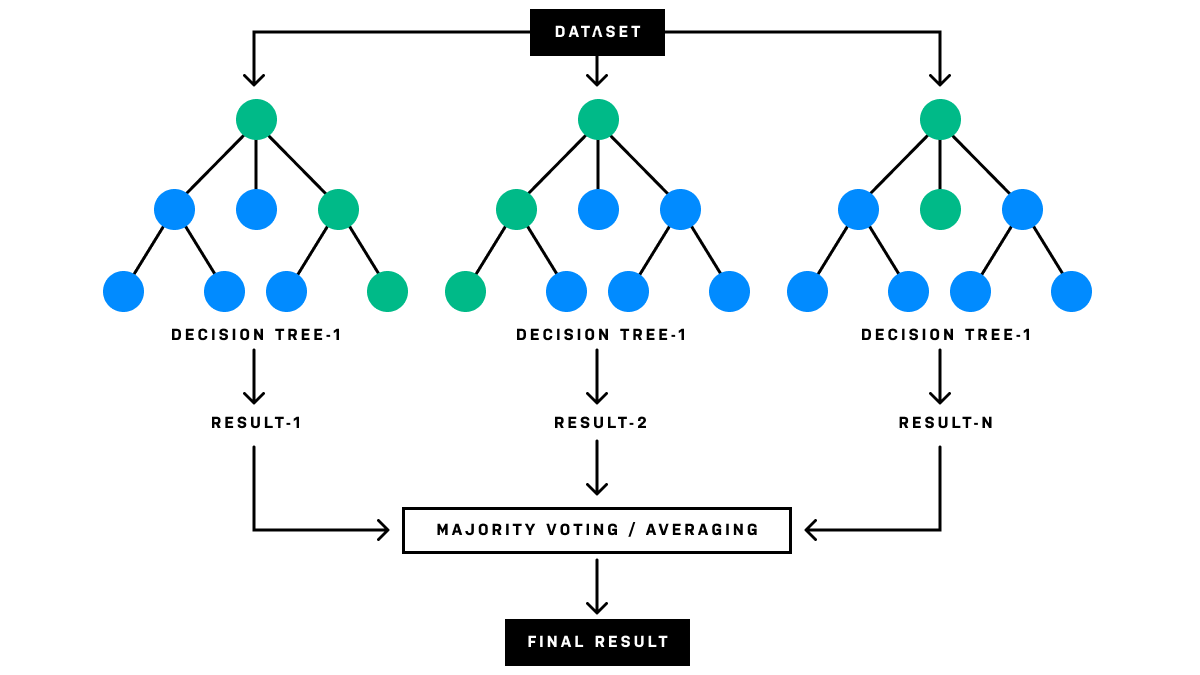
3. Decision trees & Random Forest
A decision tree makes predictions using a set of hierarchical binary “decisions” – conditions based on values of specific data points. This set of hierarchies resembles a tree; hence its name, and this makes the decision tree a great tool for visualizing and discovering how a dataset can support predictive modeling.
Let’s say a marketing team is looking to eliminate superfluous activities in the customer journey that may be a waste of time, resources, or budget. Using a decision tree, data scientists can discover which activities lead to positive customer experiences and purchasing decisions and which ones have little-to-no impact.
Decision trees can be used for both regression and classification tasks. They can model non-linear relationships and are often capable of handling poorly scaled and relatively messy data. This makes decision tree-based approaches popular for predictive model development and AutoML application.
The greatest power of decision trees, however, comes not from using a single tree at once but rather multiple, often hundreds, at the same time. This can be accomplished with ensemble learning: a technique that combines multiple models with a weighting or voting system to produce a prediction. Ensembles make predictions more robust by reducing the risk of overfitting, biases, and instability and can, therefore, greatly improve overall model performance.
One of the most prolific methods for ensembling decision trees is known as random forest, which uses a special sampling processing (colloquially known as “bagging”) to produce a large number of trees whose outputs can be averaged together to produce predictions. Because random forest is so robust, it’s a great choice for more complex applications, like cross-selling in e-commerce, drug response predictions in medicine, and identifying customers with high credit risk.
4. Boosting methods
Boosting is a specific form of ensemble learning that seeks to improve predictions by training a sequence of models in an iterative fashion, each model compensating for the weaknesses of its predecessors. Boosting can be applied to both regression and classification tasks, and is considered one of the most powerful approaches to predictive modeling problems.
There are multiple variants of boosting. Some of the most popular are gradient boosting and Extreme Gradient Boosting (XGBoost), which train models directly on the errors of previous models to reduce biases and variance. While boosting can technically work with many different types of models, decision trees are most often used in practice due to ease of implementation.
Because it’s so powerful, gradient boosting is used for high-stakes predictions where decreasing bias error is essential. It can be used in healthcare, for example, to predict the relapse of cancer or the risk of a heart attack.

5. Neural networks
Inspired by the structure of the human brain, Neural networks (e.g. multi-layer perceptron) are designed with layers of simulated interconnected neurons. Neural networks make predictions by reading data into their first layer, called an input layer, passing it through multiple other intermediate layers, called hidden layers, and finally to a last layer, called an output layer which creates the final predictions. Mathematical transformations are applied at each layer, which makes neural networks capable of learning very complex patterns.
The number of layers a neural network has is referred to as its “depth”. The term “deep learning” today usually refers to training neural networks with many layers, sometimes tens to nearly a hundred or more. The deeper the neural network, the more sophisticated and complex patterns it can learn. However, more layers also require larger amounts of high-quality data and computational resources so there are trade-offs.
For this reason, Neural networks excel in situations where predictions must be estimated from complex patterns embedded in large amounts of high-dimensional data. Common applications include large language models, generative AI, facial recognition, image detection, voice detection, and speech transcription.
6. KNN
The K-Nearest Neighbor (KNN) algorithm makes predictions about data points based on the values of other data points most similar to it, a.k.a its “nearest neighbors”. KNN is used for both regression and classification, with variants of KNN also being used for similarity matching tasks. KNN relies on very few assumptions about the underlying dataset and as such can perform well even for non-linear and complex problems where the data follows an unusual distribution.
A data scientist might use the KNN algorithm to determine their new product’s probability of success. To do so, they must determine which products already on the market are most similar to their own. These competitive products are their “nearest neighbors,” and their price, application, and other key qualities can be compared to the company’s own product to predict its success.
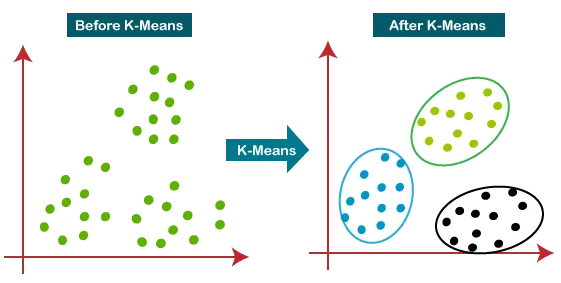
7. K-Means
K-Means is a clustering algorithm that uncovers underlying patterns to group and categorize entities in unlabeled datasets. In this instance, K refers to the number of clusters needed in the dataset. The algorithm aims to assign each data point to a cluster while keeping each cluster as tight-knit and distinct as possible. This requires some special optimization methods to figure out where each cluster should be centered for the best result.
K-Means helps data scientists more clearly understand customer behavior, then bucket those customers into categories based on that behavior. When used correctly, it offers more accurate customer segmentation, enables highly customized marketing initiatives, and enhances product development strategies.
Predictive modeling challenges
While predictive modeling certainly offers a wide array of potential benefits, there’s a reason many data science teams haven’t mastered the practice. In fact, these common challenges can thwart even the best-planned data science projects:
Choosing the best predictive model or algorithm
There are many different predictive models and algorithms from which to choose, and it can feel overwhelming to determine which is best for your unique use case. But choosing the one that most appropriately suits your needs, constraints, and objectives is crucial for getting the most valuable outcomes.
To select the right technique, start by evaluating your available data and identifying your intended outcome and expectations. Which questions do you want to answer, and how will you use those results to make specific improvements? Then, weigh the pros and cons of each model or algorithm against those factors to decide which is most relevant to your business.
Find hidden insights for better decisions with Neo4j
Predictive modeling can help data science teams better understand what the business is doing right, what’s going wrong, and what needs to change for improved outcomes. With the right approach and powerful technology for support, data scientists can make the most of projects for better forecasting and predictions and faster innovation. But these advantages are only up for grabs if you have enough connected data from the right place at the right time – and a clear vision of how you want to use it.
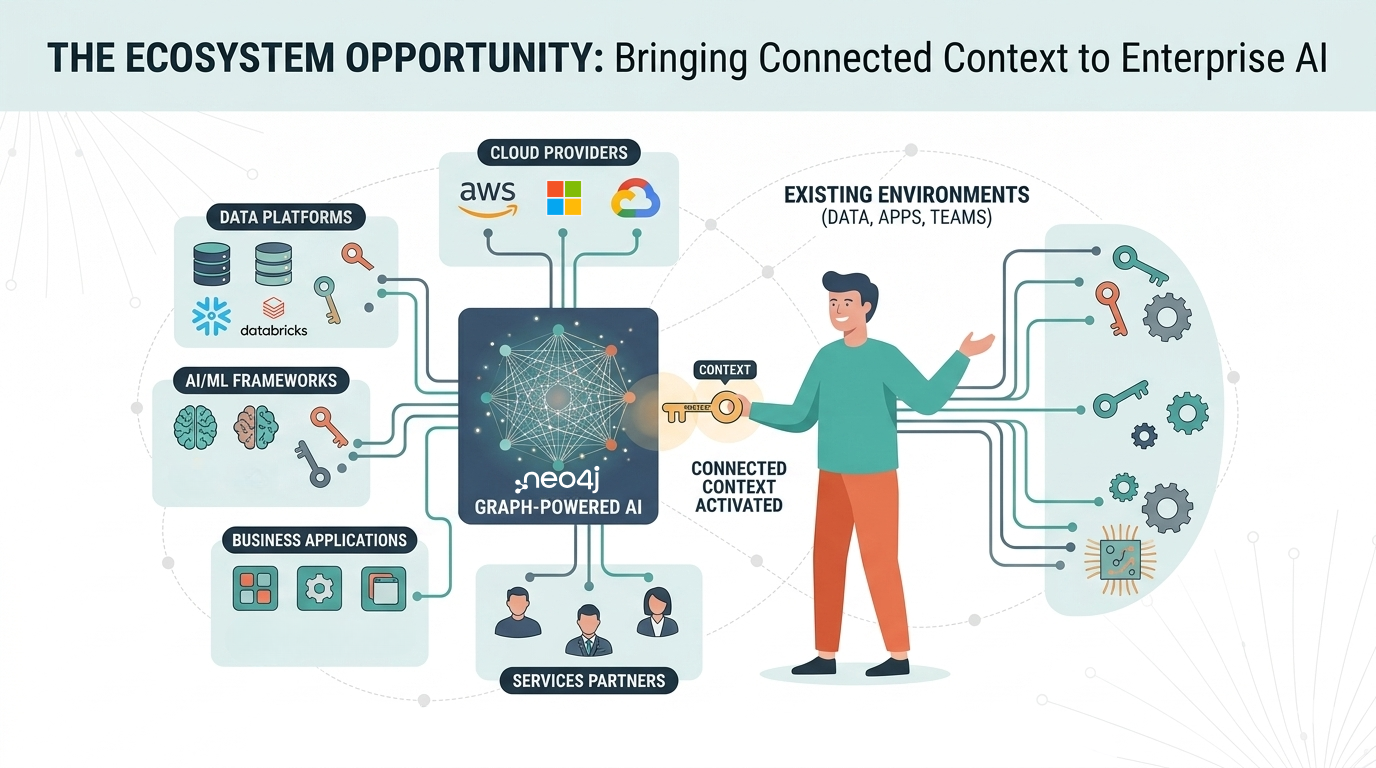
Neo4j Graph Data Science is an analytics and ML engine that uses the relationships in your data to improve predictions. It plugs into enterprise data ecosystems so you can get more data science projects into production quickly.
Because data security and privacy are non-negotiable, Neo4j integrates seamlessly with your existing data ecosystem. It fits into data stacks and data pipelines with native connectors to common tools for accessing, storing, moving, and sharing data.
With Neo4j, your team can make better predictions, build a proof of concept, and go to production using any data source to discover what’s important, what’s unusual, and what’s next. In fact, Neo4j offers the only graph data science engine built for data scientists to improve predictions and ML models, at scale, with seamless integration across the data stack to get more data science projects to production.
Learn how modern data scientists use graph data science to improve predictions.
Share Article


Explore
Related Articles
Neo4j Named “One to Watch” in Snowflake’s 2026 Modern Marketing Data Stack Report


1 of 3: The difference between a graph, a knowledge graph, and a context graph

2 of 3: Why graphs, knowledge graphs, and context graphs matter to customers
3 of 3: The graph ecosystem: Bringing connected context to enterprise AI