
Retail & Neo4j: Supply Chain Visibility & Management


4 min read
Now more than ever, supply chains are vast and complex.
Products are often composed of different ingredients or parts that move through different vendors, and each of those parts may be composed of subparts, and the subparts may come from still other subparts and other vendors from various parts of the world.
Because of this complexity, retailers tend to know only their direct suppliers, which can be a problem when it comes to risk and compliance. As supply chains become more complex – and also more regulated – supply chain visibility is more important than ever.
Fortunately, graph technology makes multiple-hop supply chain management simple for retailers and their suppliers.
In this series on Neo4j and retail, we’ll break down the various challenges facing modern retailers and how those challenges are being overcome using graph technology. In our previous posts, we’ve covered personalized promotions and product recommendation engines, customer experience personalization and ecommerce delivery service routing.
This week, we’ll discuss a graph database for supply chain visibility and management.
How Neo4j Enables Crystal-Clear Supply Chain Visibility
Retailers need transparency across the entire supply chain in order to detect fraud, contamination, high-risk sites, and unknown product sources.
If a specific raw material is compromised in some way, for example, companies must be able to rapidly identify every product impacted. This requires managing and searching large volumes of data without delay or other performance issues – especially if consumer health or welfare is on the line.
Supply chain transparency is also important for identifying weak points in the supply chain or other single points of failure. If a part or ingredient was previously available from three suppliers but is now only available from one, the retailer needs to know how that might affect future output.
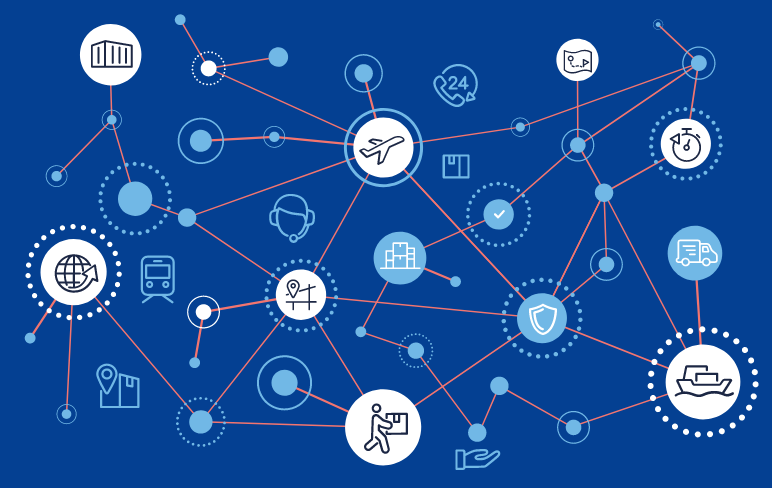
Achieving visibility across the supply chain requires deep connections. A relational database is simply not built to handle a lot of recursive queries or JOINs, and as a result performance suffers.
A graph database, however, is designed to search and analyze connected data. The architecture is built around data relationships first and foremost. This enables retailers and manufacturers to manage and search large volumes of data with no performance issues and achieve the supply chain visibility they need.
![]()
Case Study: Transparency-One
Recognizing the inherent risks of the supply chain, Transparency-One sought to build a platform that allows manufacturers and brand owners to learn about, monitor, analyze and search their supply chain, and to share significant data about production sites and products.
Transparency-One initially considered building the platform on a classic SQL database-type solution. However, the company quickly realized that the volume and structure of information to be processed would have a significant impact on performance and cause considerable problems. So, Transparency-One began looking at graph databases.
Neo4j was the only graph database that could meet Transparency-One’s requirements, including the capacity to manage large volumes of data. Neo4j is also the most widely used graph database in the world, both by large companies and startups.
“We tested Neo4j with dummy data for several thousand products, and there were no performance issues,” said Chris Morrison, CEO of Transparency-One. “As for the search response time, we didn’t have to worry about taking special measures, since we got back results within seconds that we would not have been able to calculate without this solution.”
Using Neo4j, Transparency-One got up and running and built a prototype in less than three months. Since then, the company has extended Neo4j with new modules and the platform is currently deployed by several companies.
Conclusion
With so many partners, suppliers and end-consumers growing more interconnected than ever before, retailers must have complete end-to-end supply chain visibility in order to proactively address issues in their supply chains – whether it’s a contamination outbreak or a faulty part.
However, when retailers reimagine their data as a graph, they transform a complex problem into a simple one. Furthermore, using graph visualization to manage and oversee complex supply chains allows human managers (and not just algorithms) the ability to instantly pinpoint and fix critical junctures, single points of failure and other problems within the supply network.
In the coming weeks, we’ll take a closer look at other ways retailers are using graph technology to create a sustainable competitive advantage, including revenue management and IT operations.
Witness how today’s leading retailers are using Neo4j to overcome today’s toughest industry challenges with this white paper, Driving Innovation in Retail with Graph Technology. Click below to get your free copy.
Catch up with the rest of the retail and Neo4j blog series:
Share Article


Explore
Related Articles

Top 10 Graph Database Use Cases (With Real-World Case Studies)

What Are the Types of Supply Chain Management Software – And How Do You Choose the Right One?
How to Improve Supply Chain Forecasting With Predictive Analytics
