Your Roadmap for an Enterprise Graph Strategy

Executive Director Knowledge Graphs and AI, Ernst and Young
23 min read

Presentation Summary
Every day, people consider bringing graphs into their businesses. They want to know how to win at this conversation and move their business forward.
In this presentation, Michael Moore, Executive Director of Knowledge Graphs and AI at Ernst and Young, discusses how to set a roadmap for an enterprise graph strategy.
He starts by explaining what graphs are, what graph databases do and what graph use cases there are. Then he demonstrates how to identify graph problems and how to design a proof of concept to solve the graph problems, with an example in the oil and gas industry.
Full Presentation
My name is Michael Moore. I’m an executive director at Ernst & Young. I lead our national practice in knowledge graphs and AI.
I’m responsible for our relationship with Neo4j. We’ve been working closely with Neo4j for about three years.
I’m a huge proponent of graph-based technology. I think graphs are the wave of the future. I bet that 50% of all SQL workloads are going to move to graphs in the next 10 years. This is a really valuable conversation happening. If your organization is thinking about using graph-based technology, Neo4j is a great place to start.
Graphs are here to stay. There’s lots of investment in them and there’s a real, competitive market. Neo4j is the most established player in this market, and EY is pleased to be able to work with them closely.
Today, I’m going to talk about how you begin the graph conversation at your company. I want to introduce this notion with a couple of things that you’ve probably been observing in the background.
Essentially, we’re in the middle of a paradigm shift. We are going from a traditional single-data model or single-vendor approach to management of data. This is where you take your data and transform it so it fits into a SQL style database. This works whether you’re dealing with Oracle, Teradata or a SQL Server.
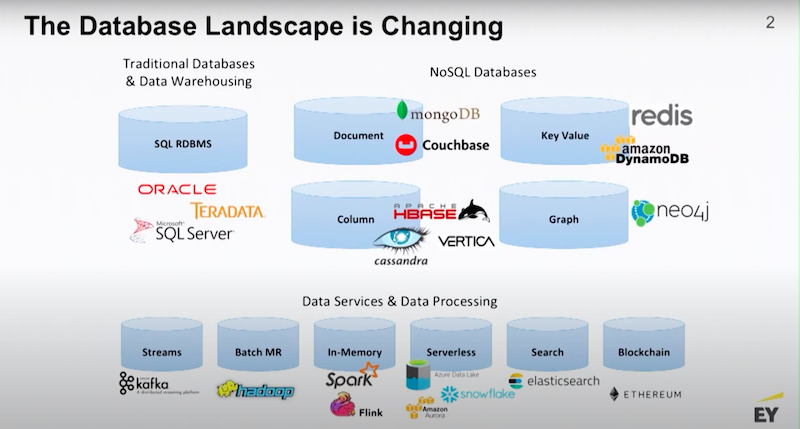
In the last 10 years, we’ve seen the emergence of fit-for-purpose databases, where the design of the database is actually designed around the shape of your data. That’s why we have this proliferation of NoSQL databases, there’s document stores, key value stores, columnar databases and time series databases.
In the new paradigm, the idea is you pick the data platform that fits the shape of your data. If your data has a lot of relationships and the relationships are the subject of interest, then you would pick a graph database.
Most of these databases are interoperable. They’re part of modern data management stacks, and they’re surrounded by a bunch of ancillary services to bring those stacks to life.
Graphs Are a Story
Why are graphs a story?
Graphs have been around for a long time. What makes graphs interesting is the hardware that allows you to literally take an entire data warehouse and put it on a single server.
A few years ago AWS made a big splash when they started releasing their X1 line of virtual machines with 4 terabytes of memory.
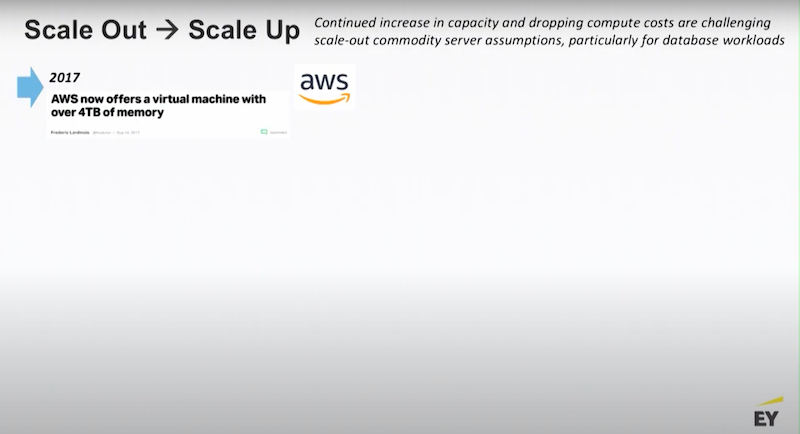
That’s a lot of memory and everyone said “Wow that’s really cool.” Then Microsoft said “You know what, we’re going to do that too.” The next year, Microsoft released their 12 terabyte machines.

Then Amazon said, “We’ll go up to the next level.”

Now, if you go to Azure, you’re able to pick up the phone and talk to your friendly Azure representative and actually get a 24 terabyte VM.
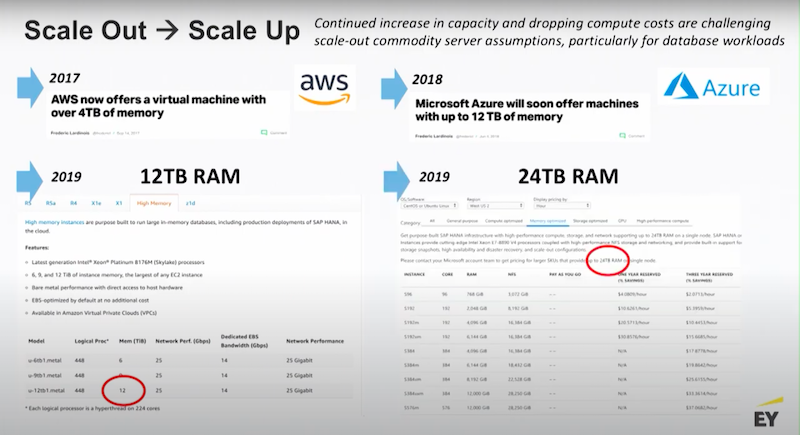
Think about that for a second. Twenty-four terabytes is a huge amount of RAM. If that’s not enough, you can go out and talk to IBM and they will gladly sell you a piece of hardware with up to 500 terabytes of RAM. I think in the next 5 to 10 years we’re going to see petabyte-scale VMs.
When you have that much memory at your disposal, why not put your data into a graph? You will be able to materialize all the relationships between your data points and have a whole fabric that you are able to query instantly.
Big hardware is the story behind a lot of graph popularity. There’s a website out there called DB Engines. They track the developer conversation around new technologies. They look at things like Stack Overflow posts, pull requests from GitHub and a bunch of other things.
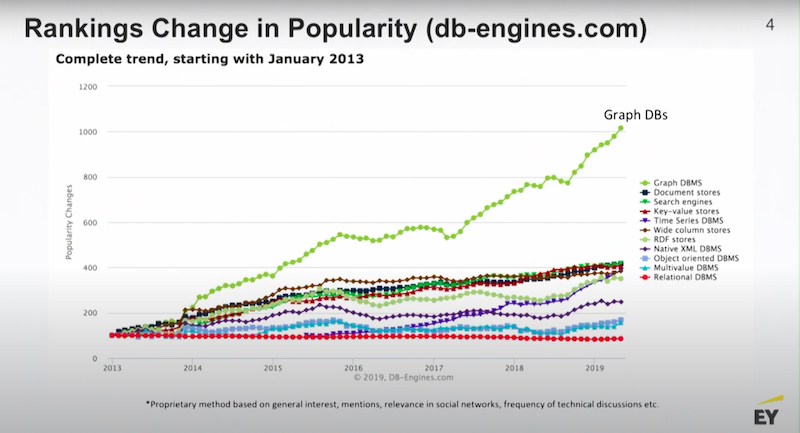
One of the really consistent stories among the data development community is graphs are hot, and the popularity of graphs continues to be the fastest increasing area of interest among developers.
What Is a Graph Database?
A graph database derives its structure and what it does from the basics of a graph. For those of you who have never seen a graph you’ve probably actually written many of them.
Any time you’re holding a dry erase marker in front of a whiteboard and begin to draw circles and bubbles to explain a business process, you’re building a graph. A graph is a visual representation of how data is connected.
It’s typical to describe business processes in terms of a graph. Below is a very basic example.
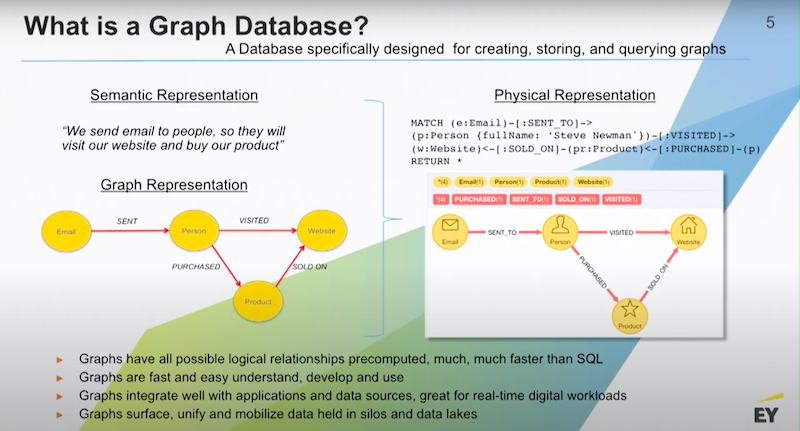
What’s ecommerce? We send emails to people. We want them to go to our website and buy our products that are sold there.
I’d have a bunch of emails. I’d be sending those to people. I want those people to visit my website. And I want them to purchase a product that’s in stock on that website. A graph database is the database that’s optimized for the storage, querying, and management of data in graph structure.
In a graph database you would have millions of records, potentially being all your outbound emails. Each one of those hundreds of thousands of emails have been sent to an individual person and create relationships. This hard-coded relationship is represented as a data point that’s stored on disk in memory. Because it’s a real object in the database you are able to put data on that relationship.
Relationships will typically be typed in the property graph model which means that they are given a name and then they become part of the semantics of the graph. Nodes and relationships also have things like directionality. I am able to say that email A was sent to a person A and that makes sense. That’s how it works in the real world and so graphs have good semantic fidelity to business processes. This is one of the reasons why they’re very easy to discuss with your business stakeholders.
These are the questions our graphs should be able to answer.
- Do I understand the business?
- Have I represented the business properly?
- Have I built a structure that we are able to query and get good answers out of?
The query language for Neo4j is called Cypher. Cypher is a declarative language like SQL but instead of having to declare what tables I want to join together and have knowledge of the keys, you’re actually declaring a traversal path through the graph.
Below is a little query and you are able to see that we’re saying “Find all the emails that were sent to this person named Steve.”

There’s a single Steve record and that record is part of the person’s set of nodes. I’m going to find all the emails that are connected to Steve and we’re also going to require that Steve has visited the website and he’s purchased something that’s been sold on the website. If that path is true, I’ll receive back a row of data from the database.
In fact, I’ll receive a row of data from the graph database in every instance where that path is true on all possible traversals. That’s how you query a graph database.
One of the first things you want to do when thinking about your graph projects is you have to get your graph goggles on.
Let’s take a look at the graph below.

Anything that’s a network is a graph.
Do you see this graph below?

Anything that has a complex hierarchy is a graph.
What about this example, do you see the graph below?
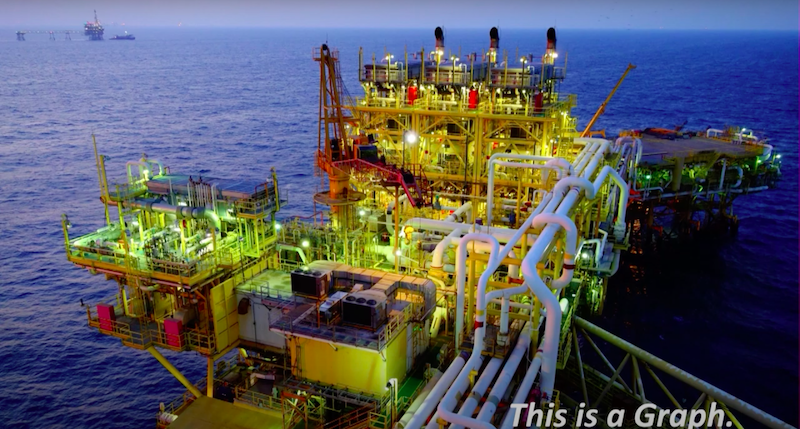
Anything that flows from point A to point B, whether it’s supply chain or materials, is a graph.
Would you consider this a graph?

Any type of transaction involving people and objects, like products or bank accounts, is a graph.
You need to think about getting your graph goggles on and thinking about data in a new way.
I want to point out that any SQL database is actually a graph.

The very first thing you do when you design a warehouse is you sit down and build the concept diagram for your data warehouse, and that is a graph. I believe that if Larry Ellison had modern computing power back in the 1970s when he was putting together the first Oracle database, he would’ve created something that looks like Neo4j.
He didn’t have the technology, and so everything that you see in SQL is basically a workaround designed to handle limited computing memory.
That’s why the users pay the cost of running a query. What do I mean by that?
When you run a query in SQL, the end user is the one who’s waiting for those JOINs to be computed in memory. That happens every single time and with every single query. In a graph database those JOINs are computed at write time. The trade off there is that a graph is a little slower to write to but it’s way faster to read from and you usually have far more reads than you have writes.
Graph Use Cases
Graphs have lots of use cases.
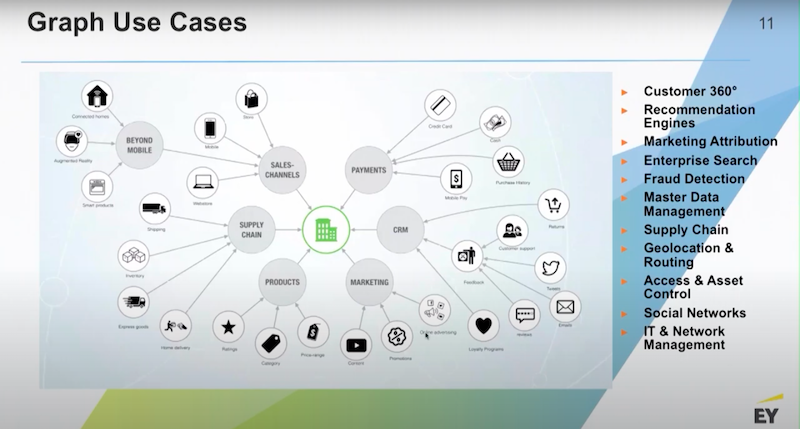
Most of our customers start with a customer 360 view or an asset 360 view. The reason for that is most of the data that goes into these kinds of views is coming from a variety of legacy systems. Maybe they’ve landed the data in a data lake but they’re still having trouble unifying the data because there’re so many disparate entities.
For that reason, customer 360 is a good place to start thinking about your graph problem but there’s many other use cases. Oftentimes, the customer 360 work will quickly turn into some kind of a recommendations engine or a detection engine. This is because pattern recognition is very easy to do in graphs and common patterns become recommendations.
Rare patterns are usually some evidence of something going away, maybe it’s a fraud ring or some point of failure in a network system. Generally speaking, we feel graphs are best deployed on top of data lakes.
Below is a very common thread through most of our graph engagements
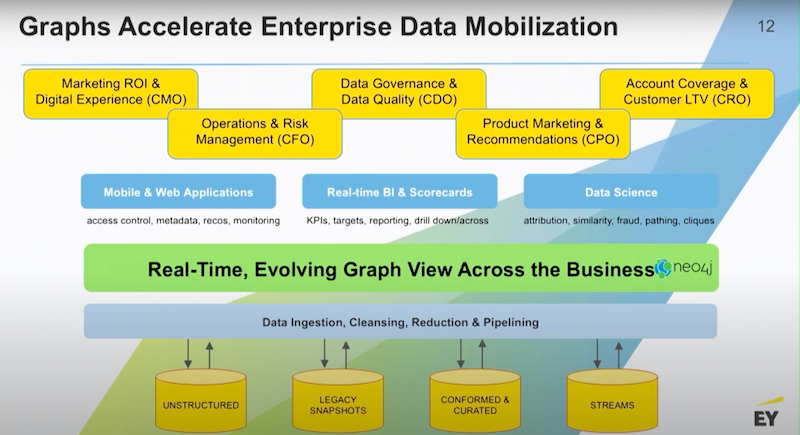
Usually what happens is some team is dissatisfied with the level of reporting and analytics that they’re getting out of the data lake. They want to do something that’s more powerful.
We might start over on the marketing side, sales side or somewhere in between in operations. Generally speaking, there’s some need to look at a lot more data that’s sitting in the data lake.
This process gives you a nice stack. Conceptually, you’re going to pull the important data from the data lake into the graph. We’re going to use the graph as a vehicle for creating a common business language. We’re going to use the graph to impose some standards around taxonomy and concordance and then we’re going to hook our applications up to that level or layer.
That connective layer of data is what’s going to drive our next generation applications in business intelligence and advanced analytics. Once you handle one or two use cases, it’s very common for the business to come back to you and say “Alright, now that you’ve solved this use case, we are able to bring in this other dataset.” And with this approach it’s very easy to do.
Let’s talk about this roadmap for enterprise graph strategy.
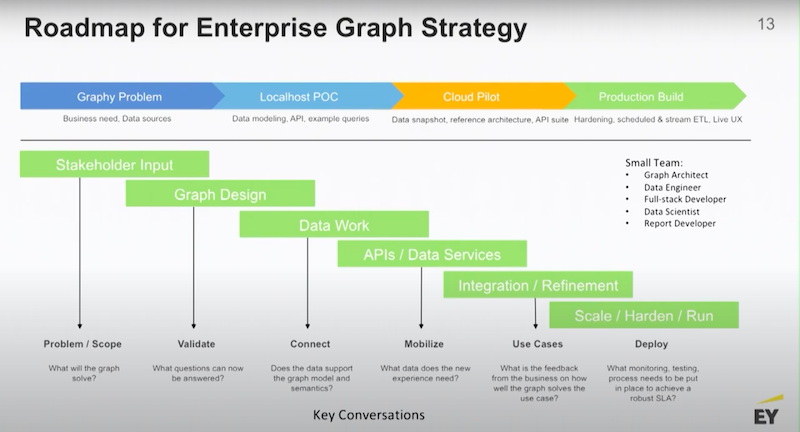
Everyday people decide to bring graphs into their business, and they want to know how to win at this conversation and move their business.
Generally speaking, you want to:
- Begin with identifying your graphing problem.
- Build a local host on your laptop and a small proof of concept (POC).
- Move that POC into a cloud pilot.
- Graduate that into a production build.
Like most data work, you need to understand your use cases so you must gather your stakeholder input. You’ll spend some time designing your graph. I want to point out that graph design is a very iterative process, and graphs are very easy to manipulate. It is easy to change the design and schemas involved in the graph. You don’t have to be right the very first time, it’s not like building a data warehouse.
You are able to come in with a theory of how the data should be connected and if the query loads or your business stakeholder input tells you something different it’s actually easy to change the graph and adapt it to that. Graphs are very flexible, even bigger graphs could have the design revisited and changed.
Data Work
Data work is inescapable; you always have to work on data. It is within the graph that you actually begin to detect some of the real issues with data. This is because you’re joining data together that has never been unified before.
There’s a lot of great ways of interacting with the graph through visualizations. Most graph stacks will have some kind of a middleware layer. The middleware layer covers supporting the APIs and talking to your applications or your BI stack and then it proceeds like any other IT project.
You don’t need a large team to build a graph. Most of the teams that we or our clients bring in are generally around 4-5 people. Typically, you’d have a graph architect, a data engineer who understands the environment, a developer of some sort depending on the use case and then maybe some data scientists, or report developers. Small agile teams work quite well.
Graphy Problem
What is a graphy problem? Below I have a hit list.
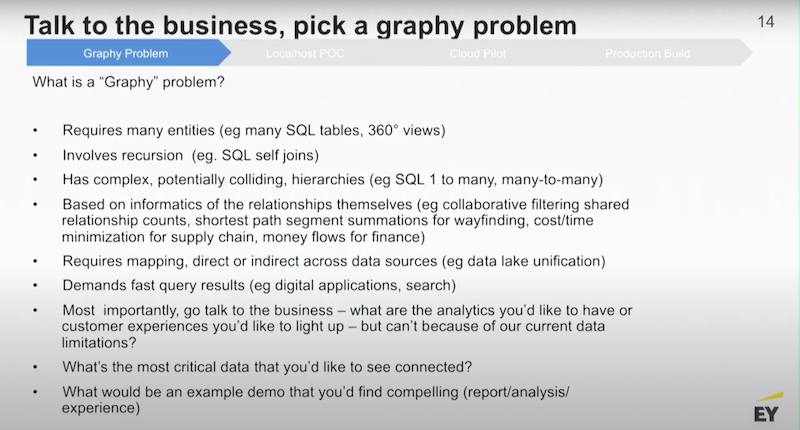
Anything requiring a lot of entities, recursion where I’m joining the same data to itself, complex hierarchy, relationships and individual records or anything that requires very fast query results are graphy problems.
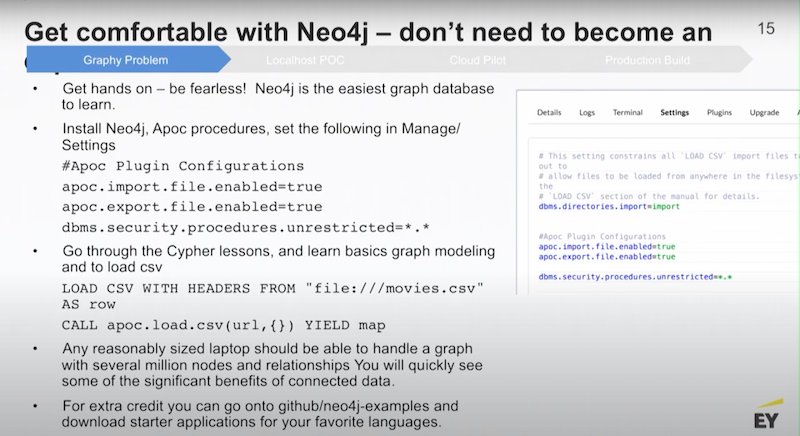
Neo4j Enterprise Edition has got a really nice desktop application wrapper around it that lets you stand up multiple small databases on your laptop. The first thing I would do is encourage you to go there, download it and use it.
There’s a really nice package of utilities called APOC. When you download the Neo4j Desktop, there’s a button there where you are able to install APOC with a single click. There’s a little configuration page and if you type in the configurations above, you can actually load data using APOC very easily.
You can begin with some CSV files, there’s a couple of ways you are able to do it. There’s a Neo4j procedure called LODE CSV, and you are able to see the local file path to dump CSV files into your graph. Or you could use APOC and load CSV from a URL. That URL could be a file path or it could be a remote web location.
Any reasonable laptop, like an 8-16 GB machine, should be able to build a graph that has millions of nodes in it. Graphs are very compact, so your local host demo could actually be a very powerful demo in terms of the amount of data you are able to push into it.
Some of the things that you might want to think about when you do your POC graph is to start with a handful of data sources; don’t attempt to boil the ocean.
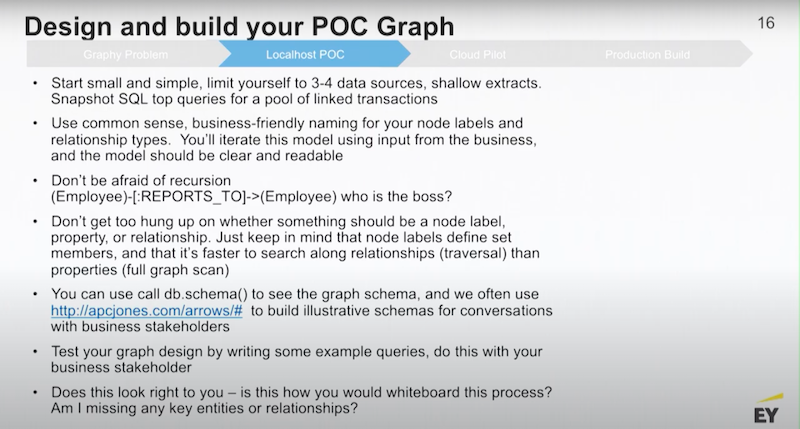
Use common sense business naming for all your graph components so that when you show the graph to your stakeholders, they immediately recognize what you’re trying to represent and they are able to give you feedback.
You can handle things like recursion in your graph design so there’s a little query for that. Employee B reports to an Employee A, that’s a totally legitimate way of designing a graph. You are able to manage things like complex recursion within a graph database.
At this stage, you don’t have to get too hung up on the design of your graph. In the early stage, you’re just trying to get a data domain, a set of business problems, put some data together in the graph and run a new set of queries that our business has never seen executed before.
If you want to show your graph to other people, there’s a great website called apcjones. There, you are able to create the schematics of your design. There’s a couple of other ways to do that.
The main thing to do is get your graph together on your laptop. Do it yourself and get comfortable with the Neo4j platform. Afterwards, write some queries against it, simple queries that are able to test your graph design. Then, when you are able to have a really nice conversation with your business stakeholders, they are going to give suggestions and ask you questions.
Customer 360 Example
I’ll give you some examples of graph schemas to get you thinking. We talked a little bit about customer 360.
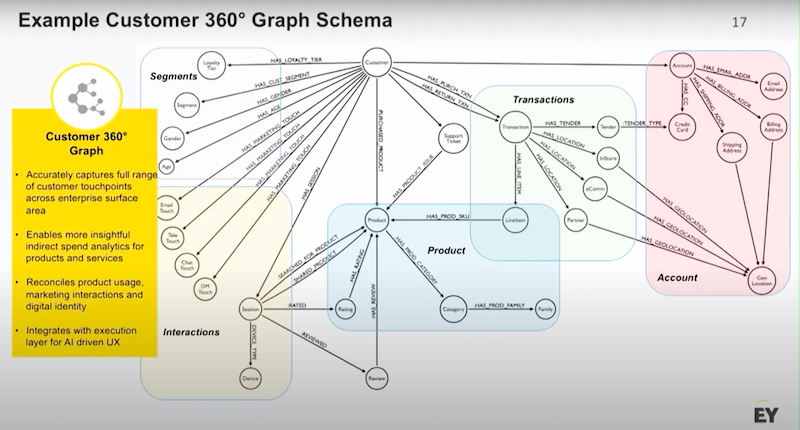
One of the reasons why customer 360 is an interesting problem is because most businesses have customers and the more you know about your customer the better off you are.
Customer data has many different shapes and sources, above is a B2C example. I have got my customer node at the top. I might have hundreds or millions of customers with data about demographics, how customers are segmented and a variety of marketing touches coming across different channels.
A customer’s identity information could include:
- Individual orders
- Different forms of tender they’ve saved
- Whether they have come through physical stores, ecommerce stores or through a partner website
And much more.
All of these concepts could be pulled together and related in a single graph, which gives you incredible analytical power.
Below is an operational scenario.

The question is, what does my procurement process look like? The main entity is a store location.
This grocery store, for example, has a whole product supply chain. They’re sourcing products, perishables and non perishables from a variety of distributors. Those products are provided to the store. They’re getting invoiced for those items and etc.
The perishables and the non perishables might be generated in specific lots. Perhaps I have some tracking and traceability that I want to be able to impose on that data. Every one of my invoices has detailed line items.
Next, I have service providers who are cleaning the store or doing the landscaping. All of these business entities, whether they’re a supplier or a service provider, are operating under a set of contracts. Those contracts are with entities. Those entities roll up to parent entities. If I’m the chief procurement officer I am able to look at a graph and see how much I am spending through this network of entities. Then, I could do a consolidation and give better pricing leverage.
With a graph in a single data fabric, you are able to traverse from a master services agreement all the way down to the individual line items in an invoice. You have a very wide span of hierarchy plus a bunch of transactional data that you are able to use analytically.
MDM in B2B Example
Below is another type of graph, this is master data management in B2B.

The concept here is that my customer in a B2B scenario is an account. The perennial problem with B2B data is I need to know what contacts I am able to talk to in that account. In a large enterprise, that could be a difficult problem to manage.
One of the things that you are able to do in a graph is use the graph to compute a best or a golden record from a variety of different data sources. The idea here is that for every contact that I have, I am able to export their contact information including phone number(s), email and a physical address. Then, I am able to use the graph to understand the data lineage and find what source a particular phone number came from.
I could see if the phone number was on an original contract from three years ago or if it was provided to me at an in person event that we had last week. Those are two totally different sources for a phone number, and you could create a rule that says “I’m going to give more authority to the phone number that I saw last week.”
For a physical address I might do the opposite. I might say use the physical address that’s on the contract or what is listed as the ship to destination rather than a physical address that I got from some webinar.
You are able to take all of those sources, trace the individual contact core data elements back to those sources, put rules on how much authority you want to ascribe to each of those sources and then compute a probability of accuracy. Finally, you hang that probability on the relationship. Now when I query my contact not only am I querying for the details of the contact, but I am able to write my queries in a way that produces the highest probability physical address and email.
This creates a dynamic master data management approach that recognizes the provenance of all of the individual details.
You’re still in laptop mode, you’ve got your data design together and you want to think about things like the breakthrough queries.
POC Graph Example

There are opportunities to apply advanced analytics through some really nice algorithms that ship with Neo4j. You want to be use-case specific. Feel free to go onto GitHub and see how full-stack interact with Neo4j. There, you are able to use a nice new interface called GraphQL, which is a new type of API.
The main question is, what is the value you can derive by putting the data in a graph? Once we know that, we are able to make better decisions.
At this stage you’ll begin to ask yourself, how do I scale and expose my graph design to a totality of data?
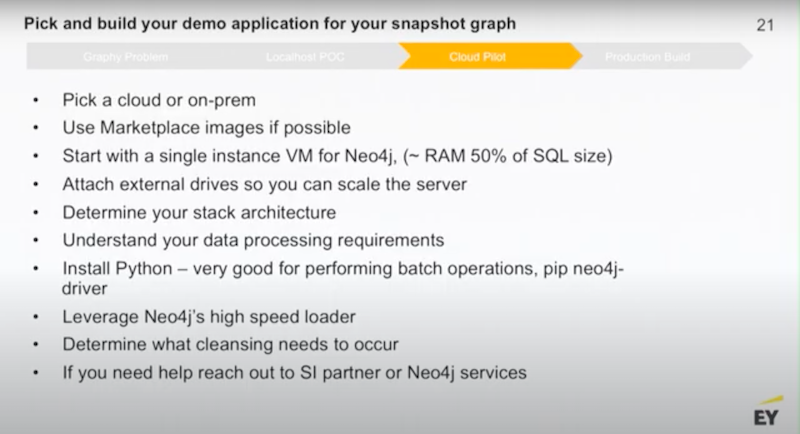
This is the point where you should start thinking about a cloud pilot. A lot of our customers like to do pilots in clouds but you are able to also do it on-premise. All of the cloud platforms have marketplace images or AMIs where you can install a Neo4j server, single server or even a cluster.
You want to set up those servers so that they have attached drives. You put your data on the attached drive and that way you are able to scale up or down, depending on how big your graph gets.
If you’re talking about sizing your machines you’ll need a VM that’s about 50% of the size of the equivalent SQL database on disk. Python is very handy, there’s a high speed loader for inputting all of your initial data. At this point you’ll start thinking about what kind of data cleansing you need. If you get stuck on this stage you are able to reach out to your friendly system integrator like my team at EY or Neo4j. We can help you get over any difficulties you might have.
As you approach your cloud pilot, I want to share with you the model that we use. The idea here is that you want to accelerate discreet, end-user experiences. As much as you might be interested in data and the inner workings of different types of databases and data management, your management doesn’t really care how you do that.
Your management cares about how you are going to help the company drive market revenue, better customer engagement and be more efficient.
Next, you’ll want to think about new use cases you could try out.
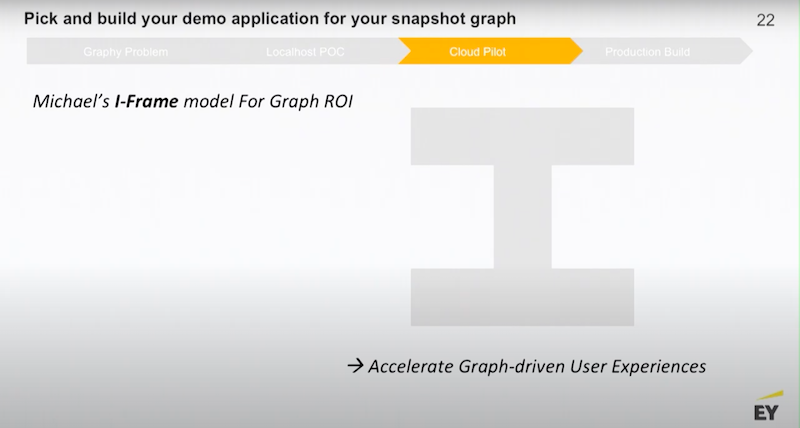
My general recommendation begins with putting Neo4j on top of your data domains.
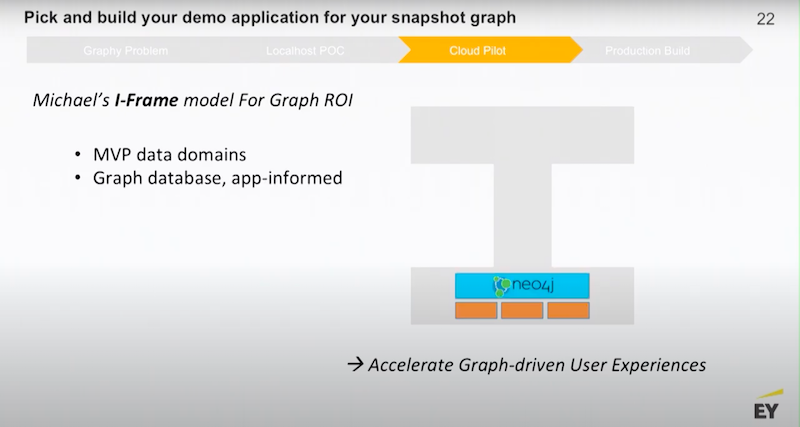
Figure out what is the minimum amount of middleware you need to build.
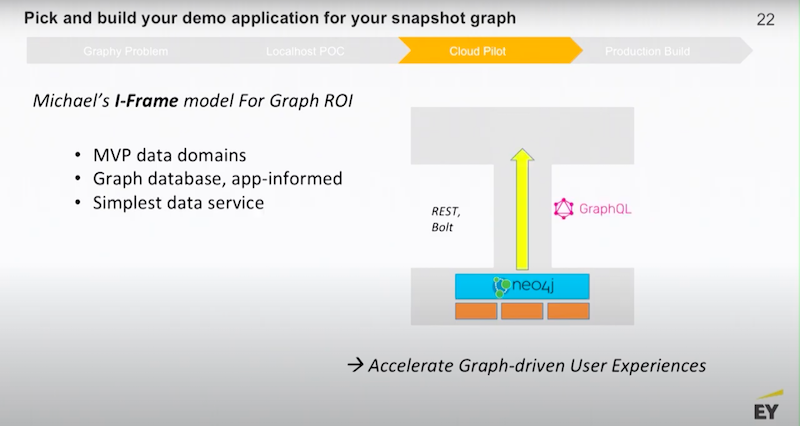
Then, take it all the way to the edge.
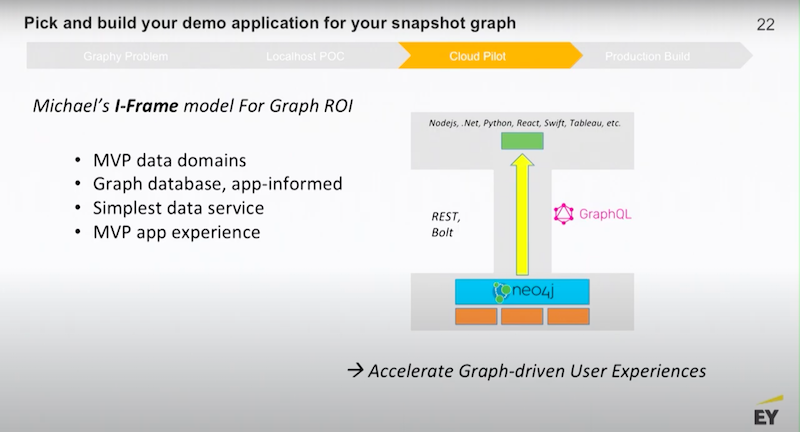
To build a new widget that is able to be deployed on a website, you need to build a new suite of BI reports that show the power of connected data. If you don’t do this part, you run a strong risk of having a very interesting graph POC that gets put on a shelf.
Your job is to work with your business stakeholders and figure out what is the new experience that will share the value of connected data.
Once you’ve done that, it’s pretty easy to add on additional experiences.
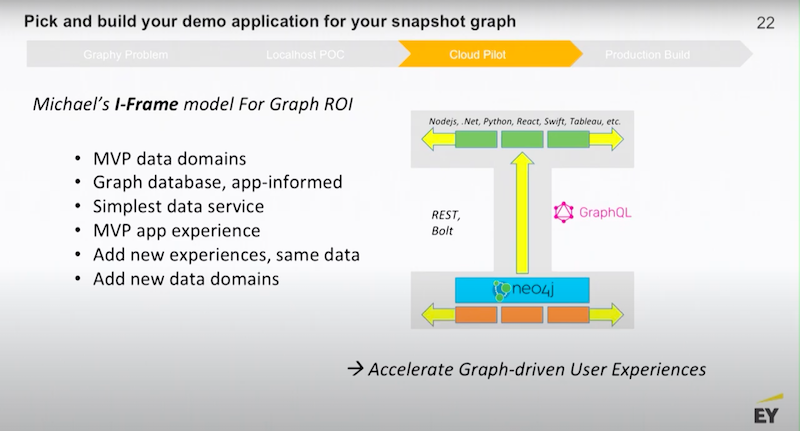
Then, you are able to circle back to add new data domains. What you don’t want to do is to try to boil the ocean. It is easy to get caught up and say, “We’re going to take everything that’s in our data warehouse, build some massive enterprise data model, dump all of that into the graph and then we’re going to look for use cases.” That’s a recipe for failure.
Example Architectures
Below I have some example architectures.
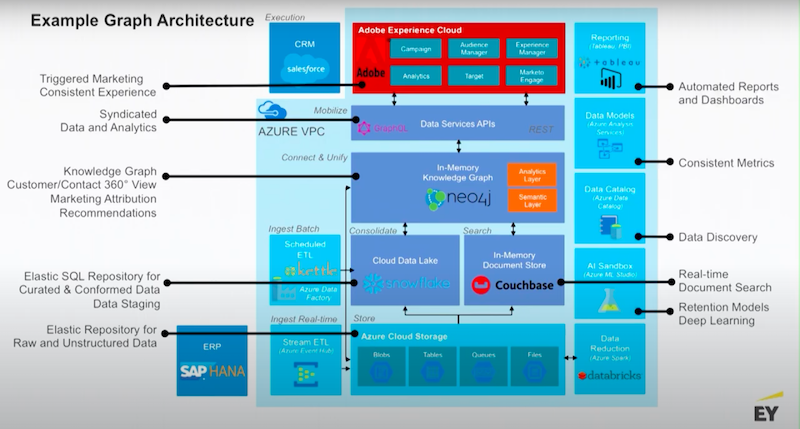
These are pointing a little bit towards sales and marketing use cases. The theme here is that you’re putting Neo4j on top of a data lake.
Usually these environments are surrounded by a set of additional value-added services that ship with the platform. Usually you’ve got some kind of execution layer, whether that’s a website or your data science team connecting drivers or APIs to the graph.
Below is a similar example for AWS.
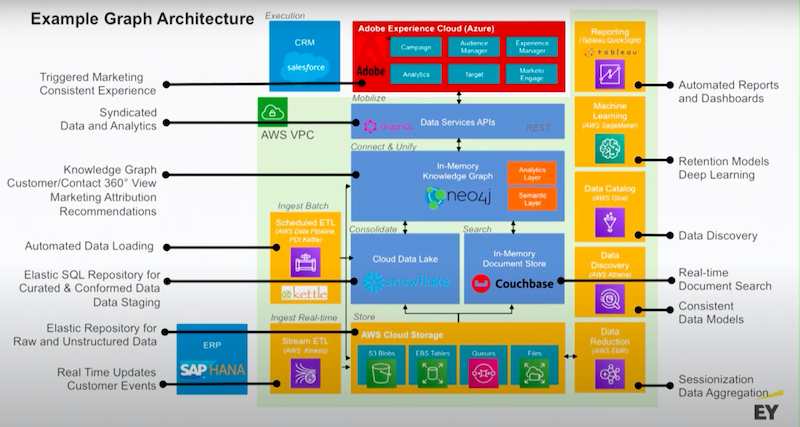
This is just to get you thinking about what cloud you might use.
I’ll point out Kettle has a Neo4j plugin that allows you to set up ETL data pipelines that are able to write directly to Neo4j. Neo4j also has connectors to systems like Snowflake through JDBC or DBC.
Neo4j also has connectors into things like Couchbase and MongoDB. These connectors give you a lot of flexibility. Neo4j supports all of your application drivers for .NET, Java, JavaScript and Python, and then there’s a bunch of community drivers as well.
Below is a preview of what you are able to do with the Neo4j loader.

There’s a high speed loader, generally what you’ll do is take your data out of your data lake. You’ll create what are known as graph-form tables. These are deep tables of nodes and mapped relationships between those nodes. Think of the primary and foreign keys that relate your data.
You’ll export those files as CSV files and zip them up, then you can load those compressed files.
The above is an example from a couple years ago. This graph had an initial load of 458 million nodes, 2.2 billion relationships and nine billion properties. Our graph loaded that in 90 minutes, that is very fast for that much data.
Volve Knowledge Graph Demo
I want to walk you through an example from the oil and gas industry. There’s an open source data set out there, it’s called the Volve field data set.
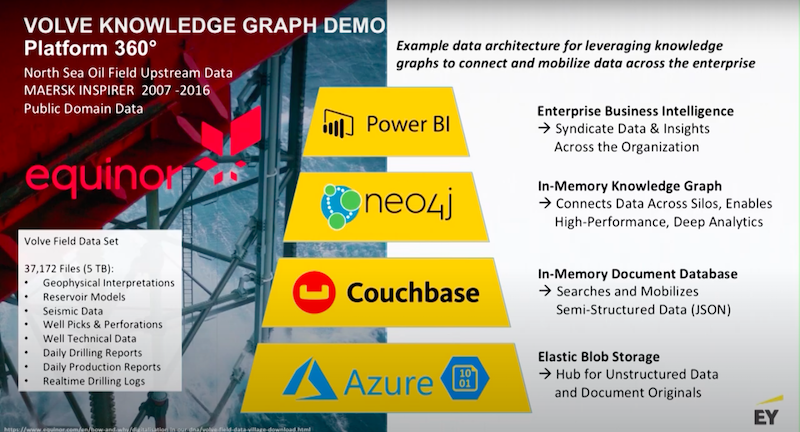
The Volve field data set consists of about 10 years of data that was pulled from an oil field in the North Sea. The data set has exploration and production data in it. In the oil and gas industry, probably 95% of the data that’s used is actually unstructured data. This makes a great example to show how you are able to use Neo4j to do data unification.
In this example we’re using Azure, Couchbase, Neo4j and Power BI. Below is the basic data flow.
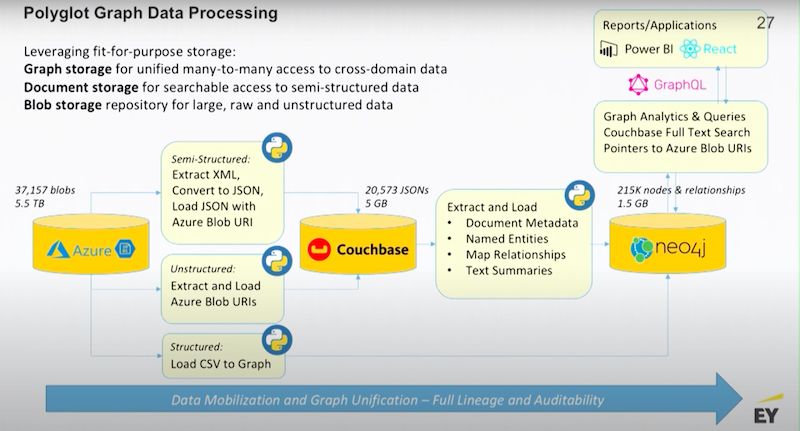
I want you to understand the degree of compression you get using a metadata management approach.
We start off with about five terabytes of the semi-structured data. There’s lots of XMLs that are coming off of the monitoring applications, those are all converted into JSONs. There’s a bunch of reports that are being generated also presented in XML, those are converted into documents in Couchbase.
Couchbase becomes the document repository. The metadata and selected commentary is then pushed into Neo4j along with all the structured data. Every single pointer to every single blob that is sitting in Azure is also sent to Neo4j. Finally, all of that data is pulled together in the graph.
Below we have a mixed use graph. The graph has some structured data that has pointers and extracts from the semi-structured data and it has pointers to all of the unstructured data.
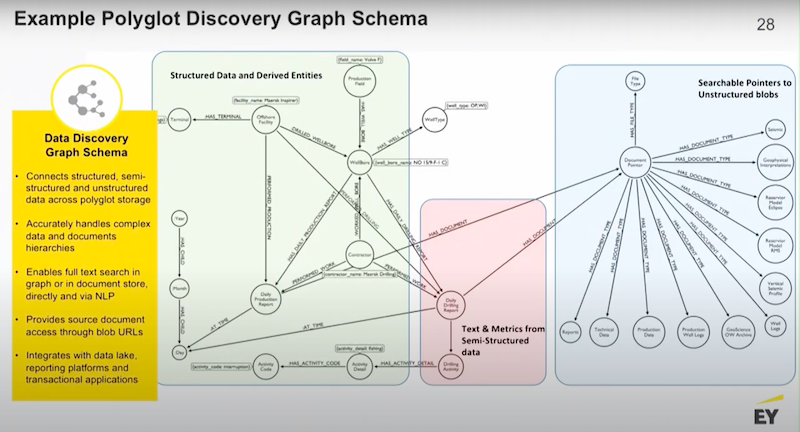
This is a relatively small graph, one gigabyte in size, we have real time access to five terabytes of data.
This has just been an example of some of the analytics that we are able to drive.
Fishing Example
In the world of oil and gas when you’re drilling and something falls down the hole that results in a phase of exploration, it’s called fishing.

Fishing occurs when you’re trying to pull that broken bit up out of that hole that’s a mile deep. That’s a bad place to be because you’re wasting a lot of money and everything is on pause until that bit of broken equipment is fished out of the hole.
The obvious question is: Who was operating the drill rig when the piece fell down the hole? Here’s an example Neo4j query off of this database.
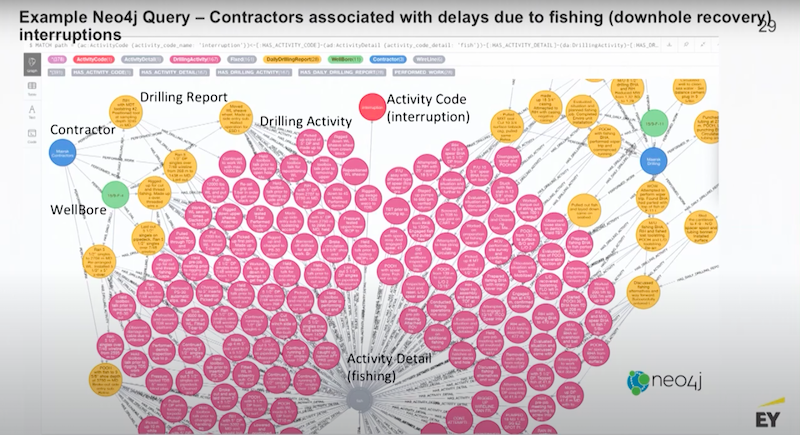
We are able to pull up every single instance out of this five terabyte of data where time was lost due to fishing. We are able to map that back to the well that it occurred on, a set of reports and then ultimately the contractor that was on duty while that was occurring. Then you are able to have a conversation with that contractor.
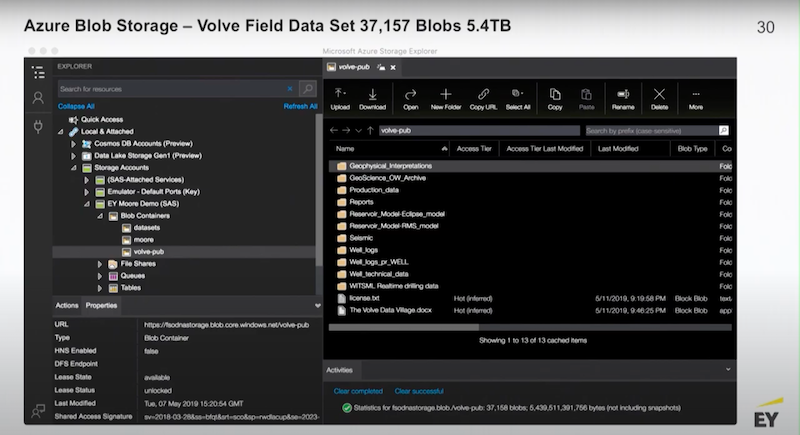
I have some screenshots of Azure’s Blob store.
This is typical data of a seismic profile.
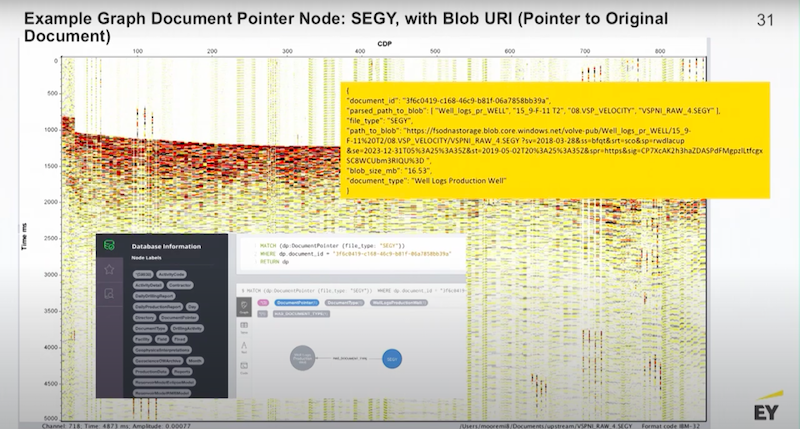
You are able to do anything with this data except pull the file. To do that it has to be visualized by some specialized application. However, in Neo4j we are able to find it, access it, search it and present it.
Below Couchbase is using full text search to find injuries.

Next is a GraphQL demo.
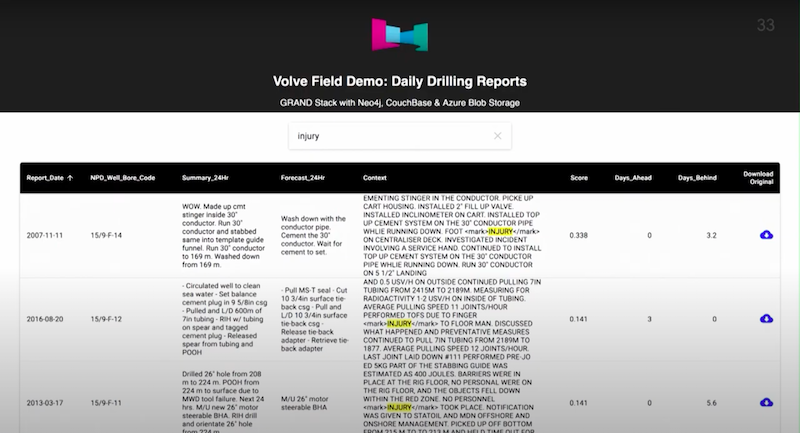
We’re using GraphQL on top of Neo4j. This is a React page and there’s an Apollo driver that allows you to access data through the GraphQL API. We’re running a full-text search. If I wanted to, I could click on any one of the little blue clouds and I could pull up the raw PDF.
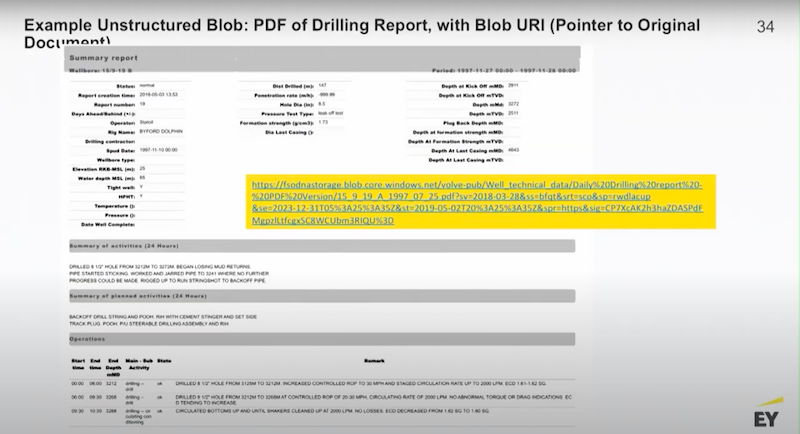
That’s an application where we’re accessing five terabytes of data.
Below is a little bit on how GraphQL works.
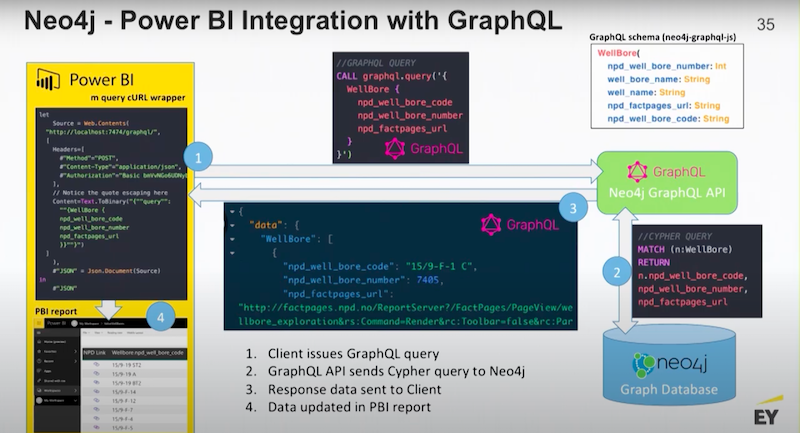
GraphQL is a structured API and it works on a slightly different premise. Essentially, you’re posting a graph-type query. Then, there’s the Neo4j GraphQL driver and API converting that query into Cypher, and then handing back the result.
This is essentially a post request. Then, you are able to integrate it directly into tools like Power BI.
As you consider broadening your view around analytics and really leveraging Neo4j, recognize that you are able to use Neo4j not only for direct management of data but indirect management of data as well.
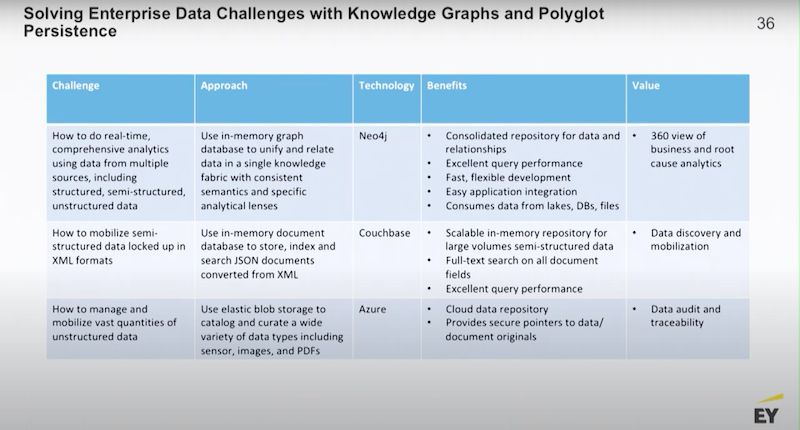
Neo4j could unify your modern data management stack and other fit-for-purpose capabilities. That is exceptionally powerful.
Conclusion
As you go to production, all the regular IT stuff kicks in. You have to think about your best practices, your security model to integrate Neo4j with active directory groups through LDAP or Kerberos and your testing environments. You want to be able to have scripted deployments using your favorite DevOps package like Jenson, Jenkins or Ansible to support consistent deployments.

You want to think about monitoring your graph to understand the kinds of queries that are hitting your graph. Then you’ll want to periodically address the structure of the graph to see if it’s really optimized to handle those queries.
Leverage your frame model so once you’re in production on a set of use cases you are able to look back on the business. Looking at your graph(s), you should be able to share where opportunities are to drive additional business value by adding new use cases.
Below, on the right is a screenshot of an application that has been in production now for almost a year, this is with Royal Caribbean.
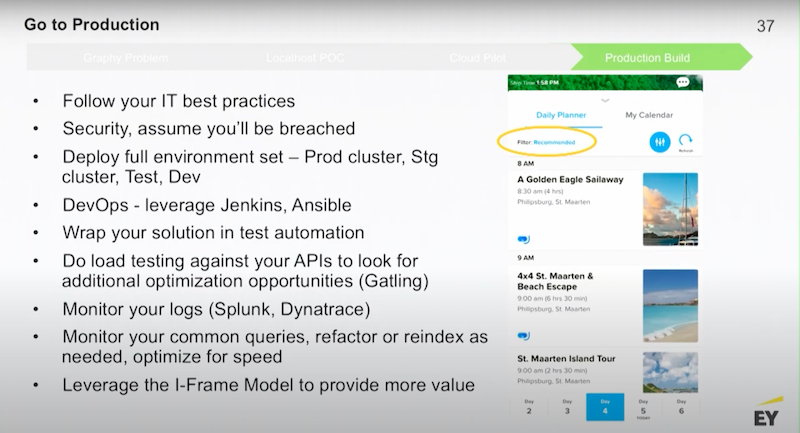
If you download the Royal Caribbean app, we have a recommendation engine that provides suggested activities for passengers. This is another form factor you are able to push out to your mobile devices, not just websites.
Finally, I want to touch on these key conversations.

As you start planning your graph at your company, figure out:
- What problems the graph is going to solve?
- What questions are you able to ask that you couldn’t before?
- What questions are you able to answer that you couldn’t before?
- What kind of data do you need to connect?
- What are you trying to do with the new experience?
- What’s the feedback from your stakeholders on these new experiences ?
Think about your graph roadmap as an agile, iterative conversation with your business.


