
The ROI on Connected Data:
Extract More Value from Existing Data Using Graphs [+ Telia Case Study]

Product Team
5 min read
From LinkedIn to Facebook to Google, top companies are driving their businesses using graphs. And use cases span industries as well.
What those new to graph technology may not understand is that creating a graph does not require starting from scratch. Existing data stores, such as data lakes and relational databases, represent an onramp to graph analytics on your existing data.
In this series, we’ll examine how investments in connected data return dividends for your bottom line – and beyond. In previous weeks, we’ve explored how increasing data’s connectedness correspondingly increases its business value and the overlooked value of context for business insights.
In this final post, we’ll explain how graph technology helps you get more value from current application data and big data alike, including a business case study for broadband provider Telia.
Connected Data: A Review of the Basics
How does data become connected? Don’t worry; you don’t have to boil the ocean. Connecting data is easy and approachable. In fact, you don’t even have to throw out what you’re already doing.
A graph database makes it easy to express and persist relationships across many types of data elements (people, processes and things). A graph database is a highly scalable transactional and analytic database that stores data relationships as first-class entities.
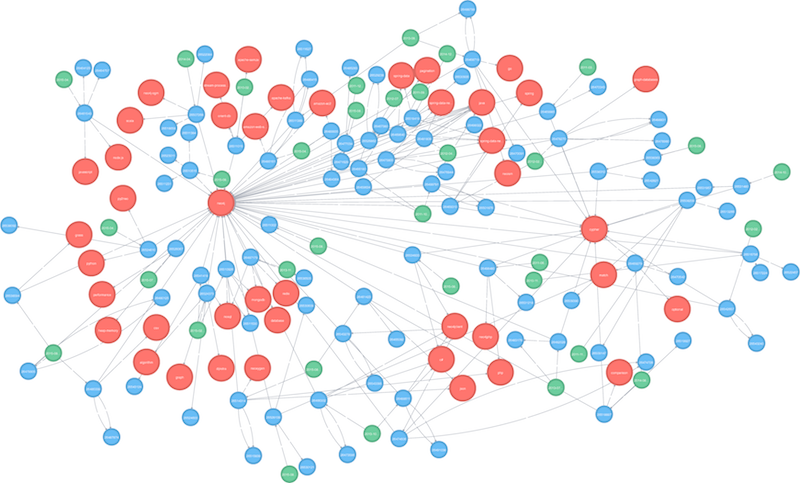
Think of a graph data model as a mind map composed of two elements: A node and a relationship. Each node represents an entity, and each relationship represents how two nodes are associated.

By assembling the simple abstractions of nodes and relationships into connected structures (imagine connecting two circles with an arrow or line), a graph database enables you to build sophisticated models that map closely to a problem domain.
Graph databases are simple and agile due to their schema-optional nature. Because the structural overhead of traditional database schema is eliminated, graphs are easily changed or updated.
You aren’t required to have a similar structure for every node. You can put data into a graph format simply by reading in a table, and if you want to add another column or attribute to that data element, you simply add the attribute.
How Connected Data Delivers More Value from Existing Datasets
Graph technology and connected data are already being used today. In fact, companies like LinkedIn and Google recognized early on the need to use the relationships in their data.
Fortunately, graph databases have become more accessible. Mainstream, out-of-the-box graph technology makes it easy for any company to apply the concept of connected data to more problems.
Regardless of where you are today in your big data initiative, a graph database helps you reach the next level of maturity. If you’re just starting out, a graph database addresses the challenge of migrating all of your data (or your metadata) into one connected place.
There are no data typing requirements or fixed structure for how the graph is supposed to be defined. The graph automatically determines the data typing, and additional nodes can be added at any time.
You also get more value out of your big data technology by using graphs to transfer knowledge of what the organization has done across other departments. Graph database technoloy keeps relationship information always at hand, but that information changes over time. The graph therefore becomes a longstanding system of record that delivers value to different departments.
For example, it enables the customer service department to approve or deny a product exchange based on the customer’s purchase, return and exchange history.
By connecting data, graph databases also enable you to leverage all of the data you’ve dumped into your data lake. You simply port your tables or CSV data into the graph database, and the database makes nodes out of the rows in the tables.
By looking at how the tables join together and building relationships from that information, you create a graph that links discrete data, such as data from SAP to Oracle to Salesforce to Marketo to your bespoke shopping cart application, and from there you reveal the connections that a data lake doesn’t expose.
Identifying connections in your data is only helpful if you know what to do with them. Graphs help you with that, too.
Today’s applications – whether they be recommendation engines or anti-money laundering systems – are powered by graphs. The graph database operationalizes the data by making it possible for the app to traverse the data. Once you have this ability, the data becomes actionable.
Case Study: Telia
Telia is the incumbent telecommunications carrier in the Nordic market across mobile, broadband, consumer and enterprise markets. In order to stay competitive, the Telia team decided to reinvigorate an area of least innovation: their consumer broadband business.
Taking a closer look, the Telia team recognized their roughly 1 million installed Wi-Fi routers as underutilized assets. Their goal was twofold: help consumers simplify their lives and help consumers better entertain within their homes.
The solution: The Telia Zone. After tracking all Wi-Fi connected devices within their customers’ homes and recording when a device leaves or enters (all collected with prior consent), the Telia team provides this connected dataset and a number of APIs to a partner-driven ecosystem of apps and services.
The result is a smart home platform that allows consumers to pick and choose apps that meet the two goals of simplification and home entertainment.
Telia Zone apps do everything from reminding consumers when they forget to lock the door after they leave for the day to letting them know when their kids arrive home after school (and turning on the lights when they get there).
Another example is the Coplay app which automatically generates a Spotify playlist based on which party guests are connected to a home’s Wi-Fi. If a guest leaves, their songs are dynamically removed from the playlist, and when they return, so do their favorite songs.
By tracking patterns of connected data around when users leave and arrive home, the Telia Zone also offers highly accurate and relevant suggestions to other apps regarding when users will most likely be at home – information that is both elusive and salient to every home delivery service.
Powering it all on the backend is the Neo4j Graph Platform. The Telia team chose Neo4j because their smart home dataset was already a graph of connected data.
Also, with Neo4j’s Causal Clustering architecture, the Telia team was able to horizontally scale their operations without always knowing what given traffic loads might be. Furthermore, the graph data model allows them the flexibility to keep evolving the Telia Zone platform without breaking existing components.
Conclusion
There is tremendous untapped business value in the connections hidden in your data.
Graph analytics bring these connections to light, resulting in lightning fast queries no matter how much data you have, serving numerous use cases across industries.
This concludes our series on the ROI of connected data. We hope these blogs have inspired you to explore how to make use of connected data to grow your bottom line and beyond.
Catch up with the rest of the Return on Connected Data blog series:
Share Article


Explore
Related Articles

What Are the Different Types of Graph Algorithms & When to Use Them?


Turning Your Tabular Data Into a Graph Using Cypher
Mix and Batch: A Technique for Fast, Parallel Relationship Loading in Neo4j
