Accelerating scientific research through machine learning and graphs


20 min read

Editor’s Note: This presentation was given by Jorge Soto and Antonio Molins at GraphConnect San Francisco in October 2016. Here’s a quick review of what they covered:
–
Jorge Soto: Today we’re going to talk about how machine learning and graph technology like Neo4j
have provided opportunities in the medical field to accelerate scientific research. We’ll give specific examples of how this has affected the research and treatments regarding cancer and microRNA.
Introduction to the role of microRNA
The high affinity of microRNA for specific cell types plays a role in maintaining the cell type identity in a differentiated state.
In 2002, the first link of other regulations at a cell level in diseases such as cancer and the differential expressions of microRNA was established. This was a milestone paper that was published in 2005. What they did is they took several tumor samples at the tissue level and based only on the microRNA expression, had the machine cluster the tumors without telling the machine what types of cancer they were. As you can see here, these are all the different types of cancer.
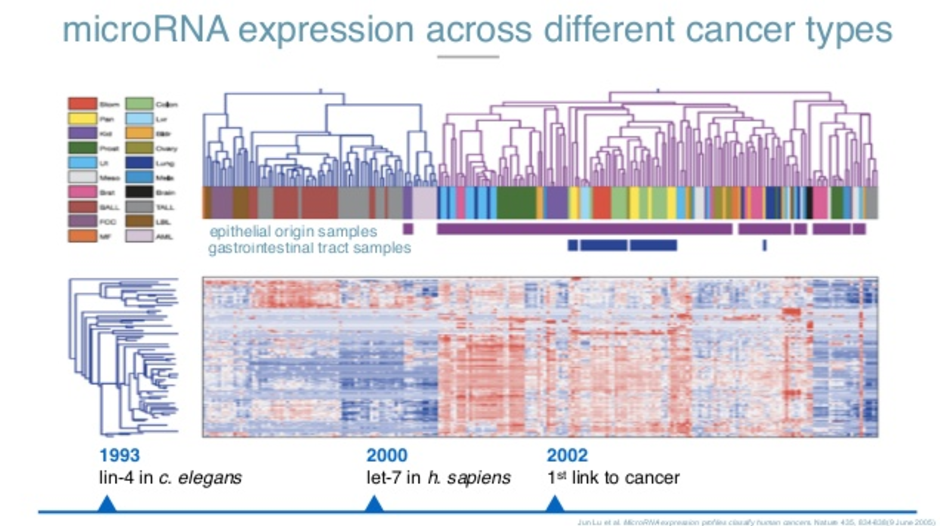
All the cancers that are of epithelial origin are clustered in the same specific way. All the tumors in the gastrointestinal tract are also clustered in the same way. Just by looking at the sequences of this microRNA and where they came from, a machine was better than a pathologist at figuring out what type of tumor it was and where it came from.
Most importantly, in 2008, one of our advisors discovered a basic trend in blood. Whenever there’s a problem in the cells at the tissue level, they break apart and release microRNAs into the bloodstream. It means cells in the heart are breaking apart. MicroRNA 122 is a little microRNA you see in the blood, which means something is happening in your liver.
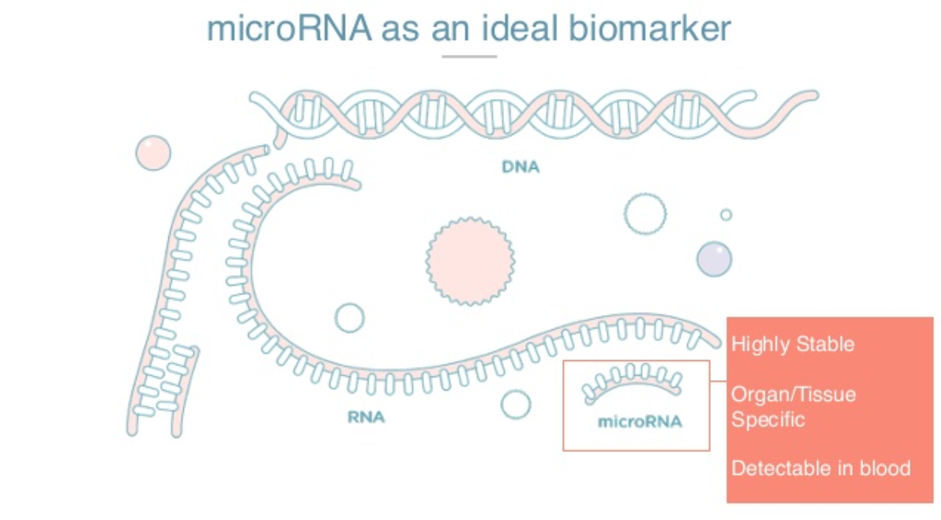
There are three very special things about microRNAs. They are highly stable and have a long half-life in blood circulation. They are highly tissue-specific and therefore can be excellent biomarkers for organ damage. Also, because they are found in circulation, we can detect them in a non-invasive way by taking a blood sample.
Monitoring microRNA
The first thing we did in our company was to test it on ourselves. This is five weeks of my life, monitoring four different microRNAs.
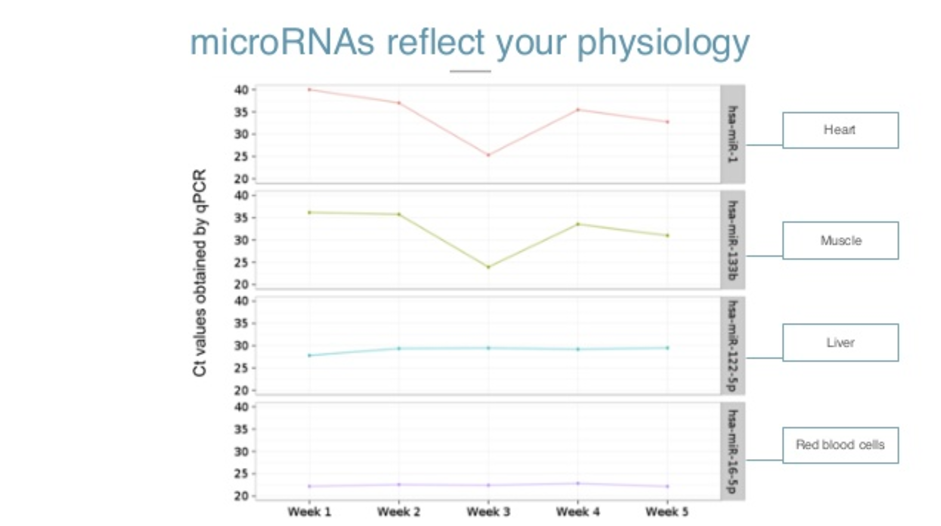
Here on the Y axis, you see Ct values of a qPCR, which is a method for amplification. The higher the number, the less a person is ill. So having around 35 and up is basically an absence of microRNA. Lower numbers indicate the presence.
So here, microRNA 16, which is a red blood cell microRNA, is very present. In the first week, microRNA 22, which is a liver microRNA, is somehow present. These two are practically absent in my life.
As I went on with my life, the levels stayed basically the same. But on week three, a friend asked me to go with him to CrossFit. I know you’ve heard about CrossFit – it’s a painful experience and my body reflected it too. You can see the cells of my heart and my muscles breaking apart and releasing the microRNAs in my bloodstream.
I could feel that I was in pain, but my physiology and my molecules were also reflecting that. I never went back to CrossFit, and the levels of microRNAs went back to normal again. So they reflect our physiology in real time.
To detect microRNAs today still requires highly skilled scientists, expensive reagents, very complex protocols and expensive machinery. There’s a lot of potential there, but it’s still very difficult to tackle. It’s not democratic. So we wanted to create a way to monitor our physiology and diagnose diseases at a molecular level with our microRNAs that is sensitive and specific with a simple milliliter of blood, and in a way that can be done in your doctor’s office or perhaps eventually, in your house.
Applying the method to stomach cancer
The first chemical application we’re targeting is cancer, specifically stomach cancer. One out of three people sitting here will be diagnosed with cancer. Of those, one out of four will die because of it. If we continue thinking about cancer in a reactive way instead of a preventive way or detecting it early, those numbers will not change. They will continue increasing.
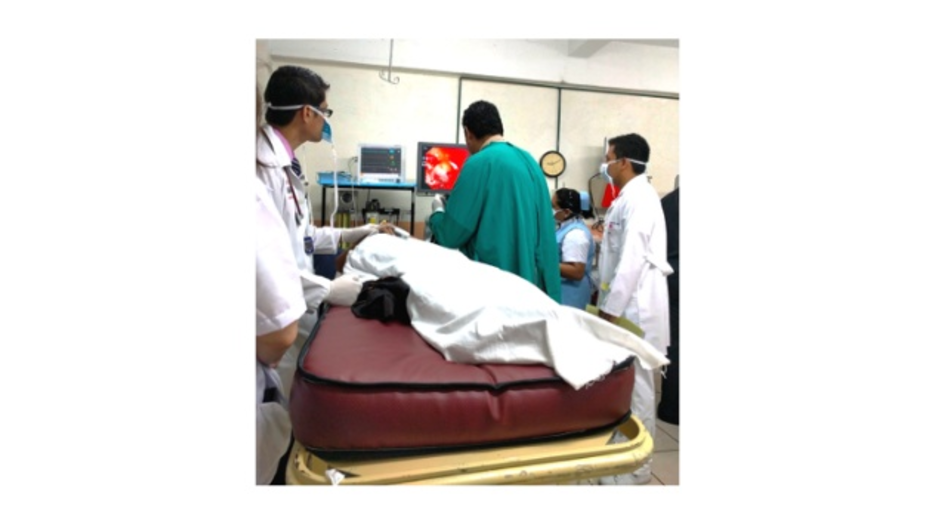
Pictured above is the way to diagnose stomach cancer. It’s an endoscopy and it hasn’t changed since 1965, when endoscopy was introduced in the clinical sector. So if you had a chronic stomachache in 1965 or in 2016, the way to detect stomach cancer is exactly the same.
The outcome is also most likely also exactly the same. This particular cancer is the second deadliest cancer in the world. Out of 1 million people that are diagnosed, 80% don’t live more than 18 months. That’s why we decided to focus on this cancer first.
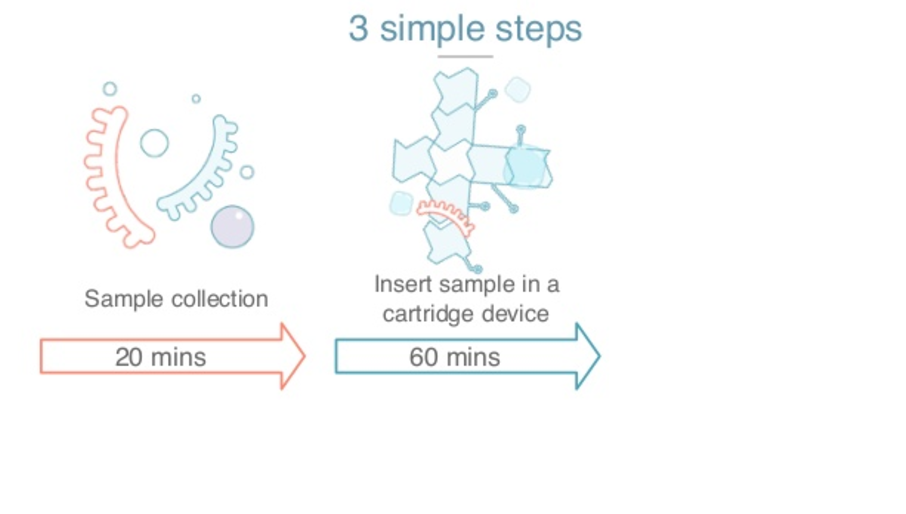
There are three different steps for the plasma that we developed. The first step is collecting the blood sample, one milliliter of blood from the vein and mixing it with the reactional chemistry that we created.

The main milestone we created here is that it can react in very simple conditions. Just one stable compressor generates a very complex protocol for this. Whenever there’s a specific microRNA that we’re looking for present, it will shine with UV light. Here you can see it with your naked eye.
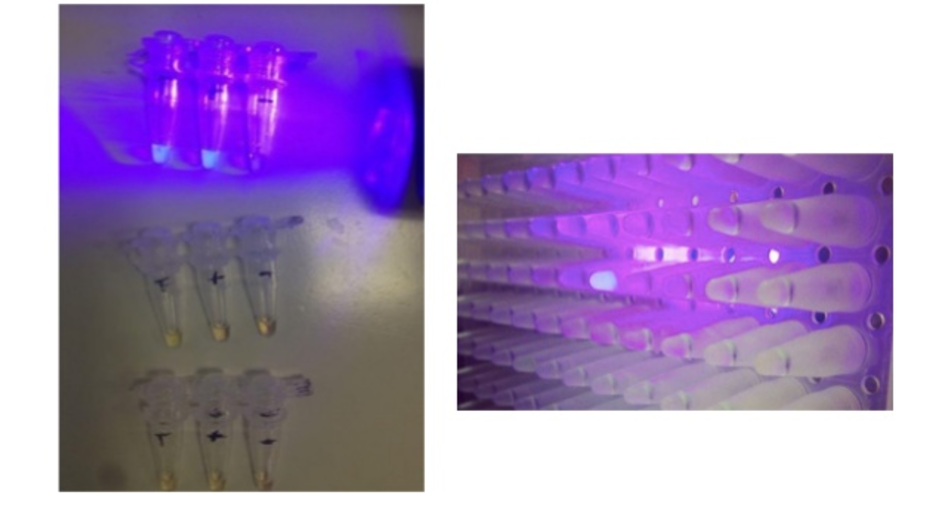
Imagine that each of these wells is looking for a different microRNA and each of these wells has a specific fragment. You combine the sample of the individual and if it shines after a reaction, it will shine with this UV light. The way it looks data-wise is that it creates exponentials.

On the Y axis, you see fluorescent units. On the X axis, you see time. Based on the sooner it shines and how many units it shines, we can also figure out how much of that specific microRNA you have.
The second thing we did to fix the need for highly skilled scientists, is build a platform based on a technology called data microfluidics, which is where you have a cartridge like this one.
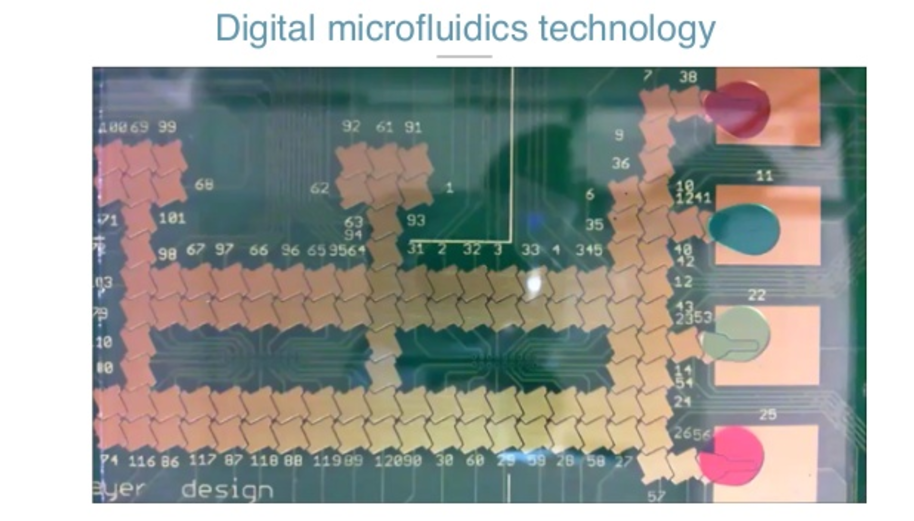
This is a PCV board. It’s the size of your phone and is just an array of electrodes. When you put the cartridge inside an instrument, it applies voltage to a specific electrode.
Then you have the PCV, and you have a plastic cover. That plastic cover is connected to the ground. The micro-space between the PCV and the plastic sandwiches the droplets, the sample and the reagents. When you apply potential, it creates a capacitor’s force that can make the droplets and the reaction move.

That way, all you need to do is get the sample, put the cartridge inside the instrument, and with software, we can automatically move and dispense unique, specific and very accurate amounts of a specific radiant. We can mix them. We can move them to the reaction source. The user doesn’t need to have any skills to input an inlet of plasma. In all this technology we have 28 different patterns in 11 different families.
Now my colleague Antonio will talk to you more about the data analysis section and explain how we’re using data to not only analyze our experiments, but also to understand why it’s already out there for all our incoming work.
The old process of research
Antonion Molins: We have a great biomarker, and we have great technology to detect it, and now the last piece is to be in a predictive model that diagnoses the disease that we’re interested in. To do that, we need to be nimble. Here, we have the machine we use to view those models.
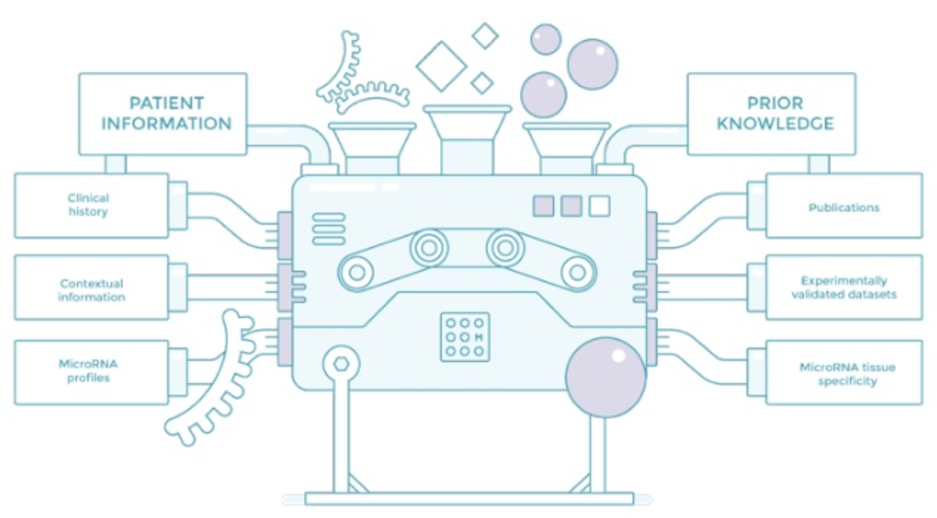
We need to collect data about the patients. That means the clinical display, contextual information and microRNA profile so that we can have valid data. MicroRNAs are an emerging field, so there’s a lot of controversy and not enough data, and this data is very expensive to collect.
The other thing that we do on the other side of the machine is try to collect primes. We try to use everything that is known about microRNA to accelerate our trials. I’m going to be talking about the first two: publications and valid data. This is existing data which scientists have painstakingly collected or findings that they’ve seen in the lab so that we can leverage later, and then other known vital microRNAs. Let’s just start with the literature, the validated data.
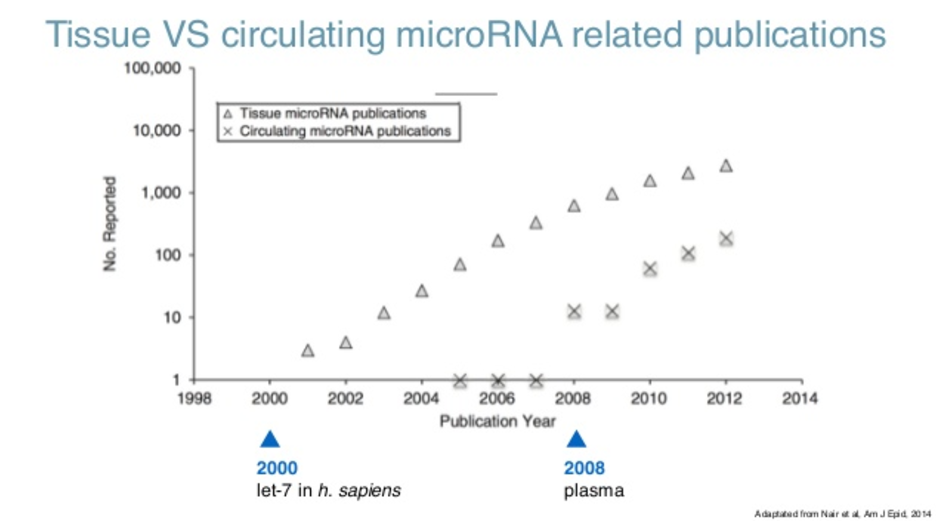
If you look at the literature (and this is the querying partner that is our repository of literature for everybody), if you just look at the number of publications regarding microRNA, you can see they were detected for the first time in 2000. What you see there is that the findings, which is the number of publications per year about physical microRNAs, has been actually growing exponentially. Right now, it’s kind of plateauing at 2000 papers a year.
When you look at circulating microRNAs, which is what we are interested in, microRNAs in blood, they were first detected in 2008, and also leading to cancer and also growing exponentially. That’s a blessing because we have a lot of information, but it’s also a curse because trying to read this information would take several lifetimes.
Typically, this is done by going to the public and looking for whatever it is that you are interested in, in this case microRNA-34 for breast cancer. You’ll have a lot of results; scroll through them until you find something that actually has to do with what you are interested in.
Try to retrieve that paper: If you are lucky, that paper will pertain to the open axis subset, so it’s not behind a paywall and you don’t have to pay to read the paper. Once you actually do that and go through the paper, eventually you will find something that you didn’t know.
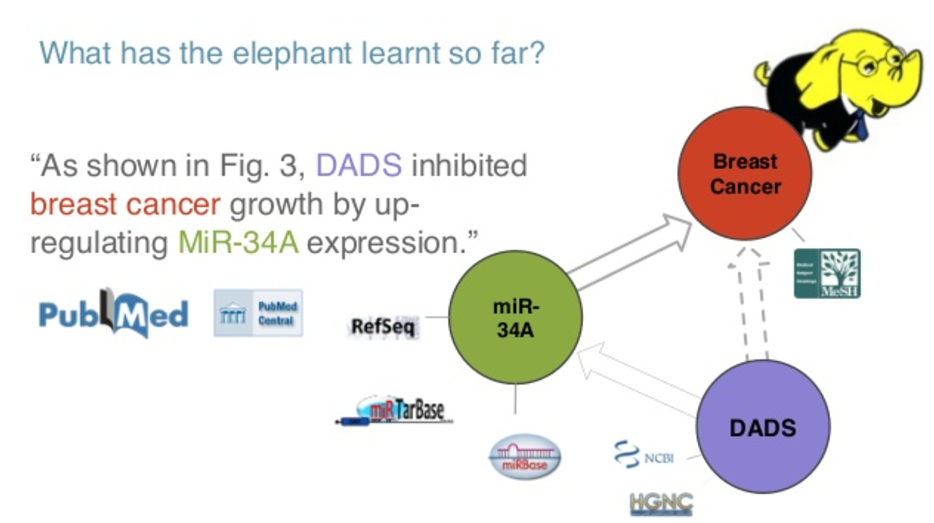
In this case, what it’s saying is that the specific gene called VADS inhibits breast cancer by up-regulating microRNA-34. So you have a link between a gene and a disease through a microRNA. In your head, you can populate this graph of knowledge that actually has something to do with breast cancer because of microRNA-34.

The problem is that this sort of information is growing exponentially. So what we tried to do was to replicate this cycle of searching, choosing, retrieving, reading and finally learning at scale. We tried to remove certain parts, and said, “What about if we just bring it together?” We didn’t have time to do that, so we hired an elephant to do it.
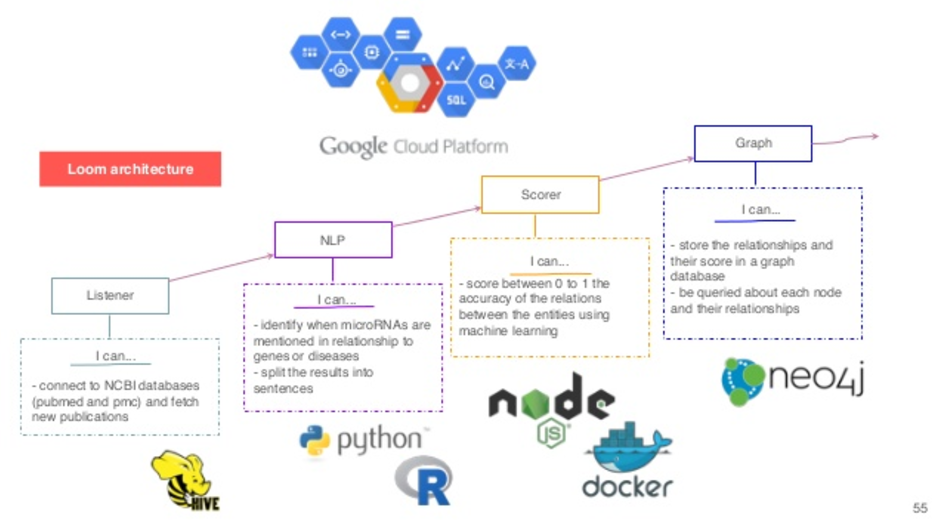
Using graph technology to handle medical data
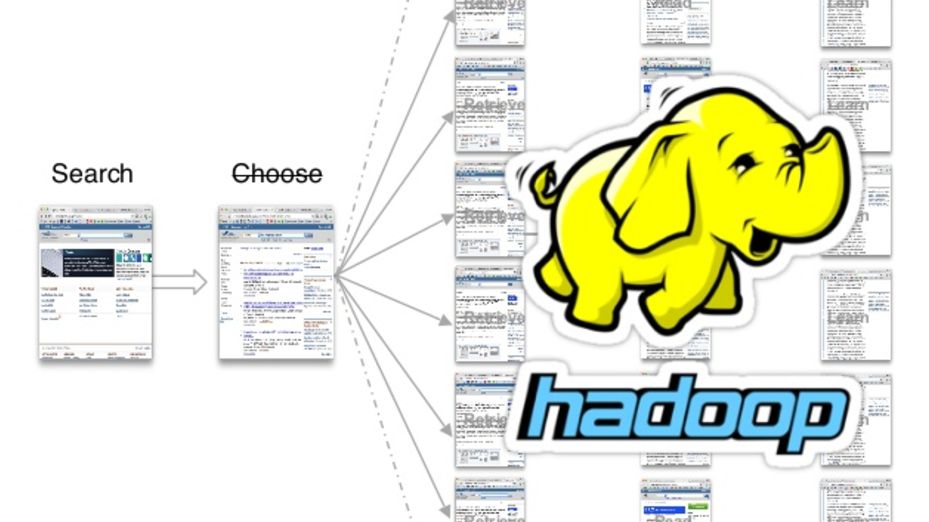
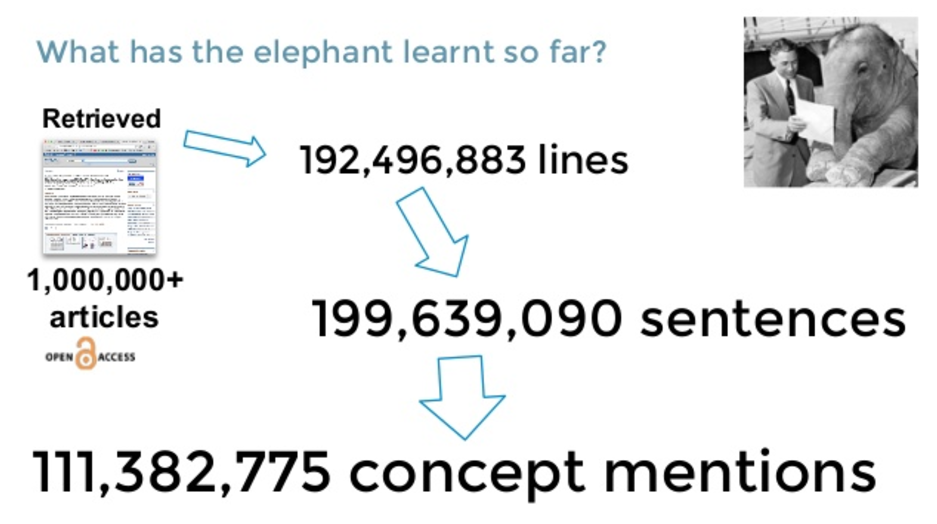
Using Hadoop, we could actually read all the open access subsets comprised of more than a billion articles and counting. These are figures from last year, with something like 200 million sentences and 100 million concepts mentioned. So we retrieved those papers. We used standard natural language processing (NLP) to break them down into specific sentences, and we know where those sentences are, which paper it is and so on.
Then we do name recognition to try to find out what’s the gene in the sentence, in the case labs, what condition of breast cancer, and what’s the microRNA? At this point, we already have some kind of link between the three entities because they have it co-referenced in the same sentence, but we still don’t know what those sentences mean. That’s where we leveraged this validated data service.
So, what I mean by “we still don’t know what the relationship is”, is that you can have a microRNA and a gene in the same sentence because the people actually found some relationship between them, or because they did not find a relationship between them. It’s not always an obvious connection.
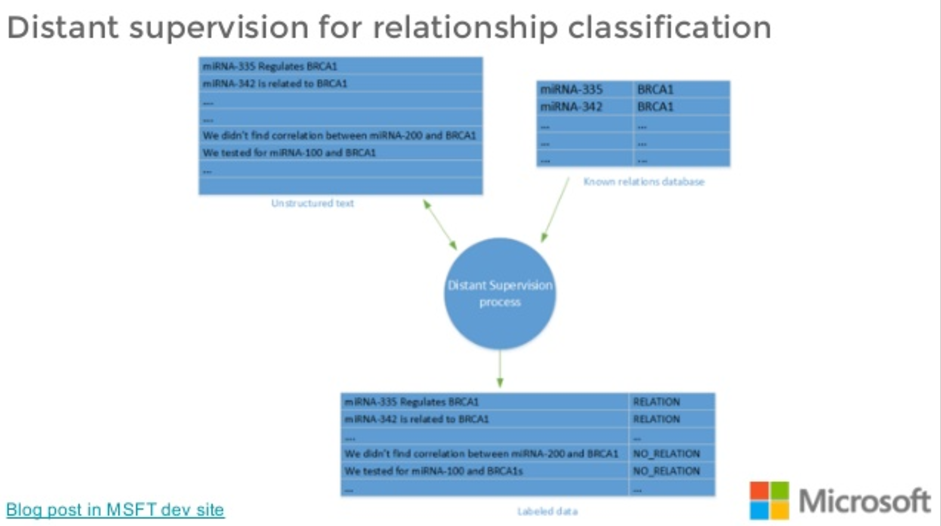
What we do is we get those sentences and we try to match them with our validated set of interactions so that we end up in what’s called a distant supervision classification scheme. We end up with a labelled set of sentences that are hopefully an average.
So not all the sentences that name a microRNA analysis that are related will actually talk about a real relationship, because the data doesn’t 100% agree. But the hope is that directionally, most of them will talk about a positive relationship.
We use that dataset to train a predictive model on these relationship types. We’ve been working at this for a bit actually, as part of Microsoft. These are training models that get sentences and classify them in expressing a relationship or not. Once we have the labels for the relationships, we can populate that graph.
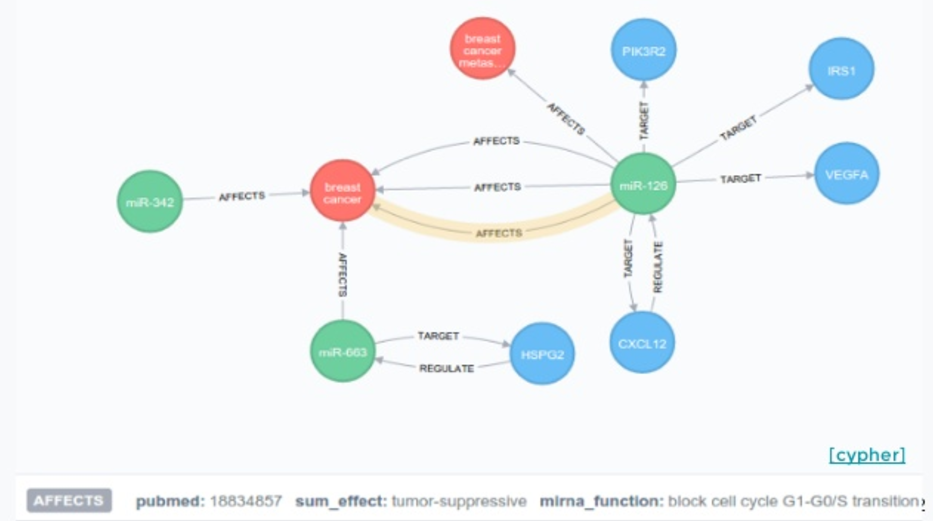
So we have different nodes, and we tag them as microRNAs, genes or diseases. We have relationships that we have extracted from the literature. Now, if we go to Cypher and try to do a query on a specific microRNA, what we see is not very useful.
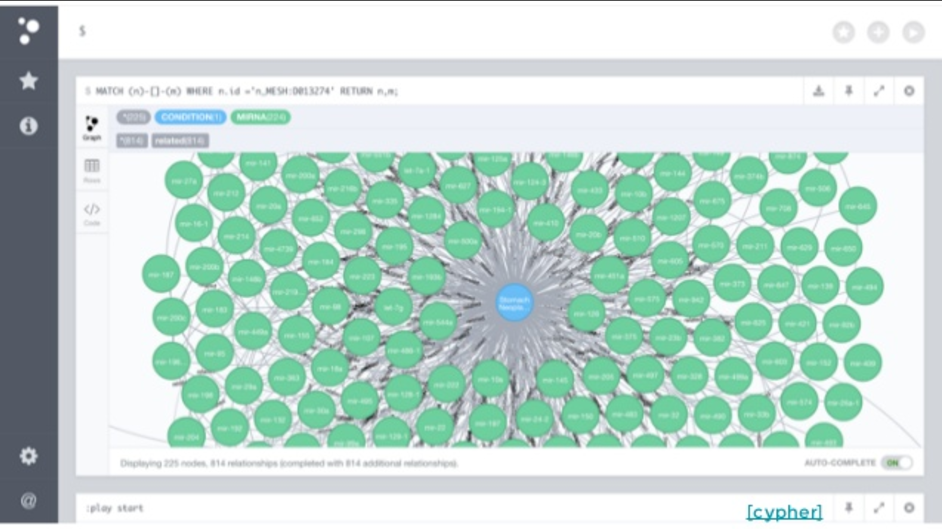
So, we decided to go one step farther and build a DI that’s actually publically available that helps you navigate this. When you open it, what you see is a representation of the disease, microRNAs and genes, all color-coded.
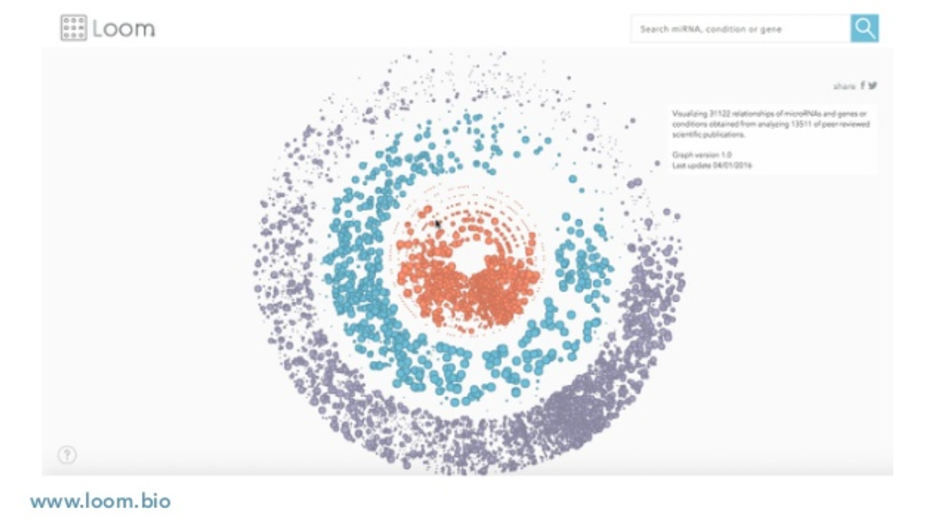
You can look for any disease that you care about. What you would see is different microRNAs that are linked to that disease. If you click on one of those microRNAs, we’ll show you the sentence that we found relating both. You can click on any of those and go to the whole paper.
If you do the same with a microRNA, you have the genes on one side, the conditions on the other side, and you can still do this. This helped us a lot trying to find specific microRNAs that were related in our case with gastric cancer.
In general, in-house help does establish that relationship with the scientific community. People find a lot of value in first going to the findings that you actually want to look at and then pulling the paper, instead of the other way around. It seems to be more efficient.
In the backend, we are using Hadoop and Hive to collect and organize all this information. We are doing some natural language processing in breaking up those sentences, doing the name-entity recognition and so on. We have a score that is the national model about how to classify those sentences. And finally, we started this graph database that we espouse with them.
On the other side of the machine learning machine, we have data. This is not the data that would come from our patients, but the data that we are going to use to train them up. What we were looking at doing, one of the things that was very clear, is that there’s not that much consensus in the literature about findings. That’s normal for a field that is young. This can also be ascribed to specific limitations of the status.
When we looked at the number of subjects that were involved in studies trying to link microRNAs with a specific disease, it was difficult. There are 50 of us cohorts, which is not enough for building a pretty model on microRNAs. These translated into not that many validation studies.
So, there’s a lot of discovery studies in which there’s some finding reported, but then there’s not a validation which these findings are validated in a different cohort, or in a different population, and so on. That’s the main problem that is there with microRNA reports today. It’s not that the research is wrong. It’s just that the design of the study, the data collection – this data that you’re going to feed into machine learning machine, is biased in some way, obviously incomplete.
Designing a study for stomach cancer
With that in mind, we tried to design a study for our application for stomach cancer. We tried to follow the guidelines of the FDA in trying to decide one of these studies. So, there’s three things you have to prove.
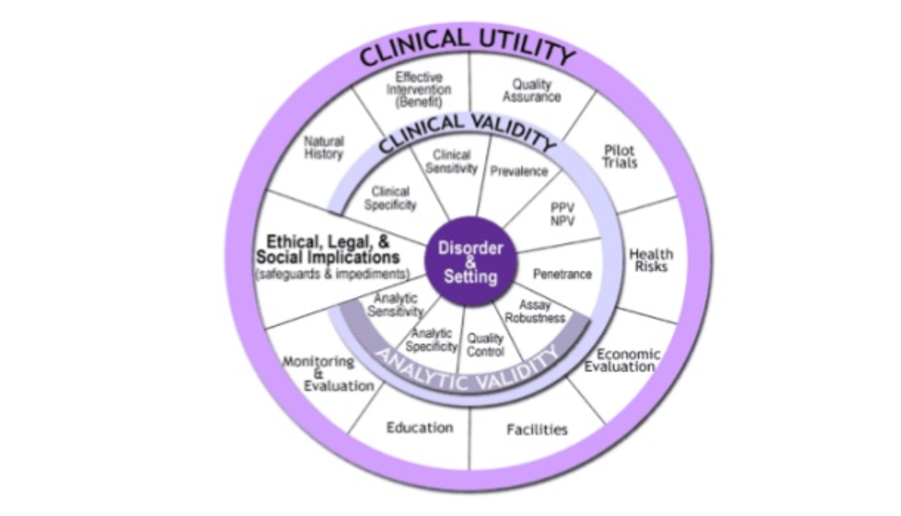
One thing is ultimate validity, which means that you are measuring what you claim to be measuring. That has to do with the platform that Jorge explained to you. We know that we can measure microRNA in specific and sensitive ways.
There is clinical validity, which means that these microRNAs are actually linked to the disease that you are trying to predict. Then there’s clinical difficulty, which is that the output of your model passed on consequence in either the prognosis, the therapy or the outcome of the patients that you are giving this number to.
So for the clinical utilities, Jorge talked a bit about stomach cancer. Stomach cancer is a huge problem. From the one million new diagnoses a year, there are 800 thousand deaths a year.
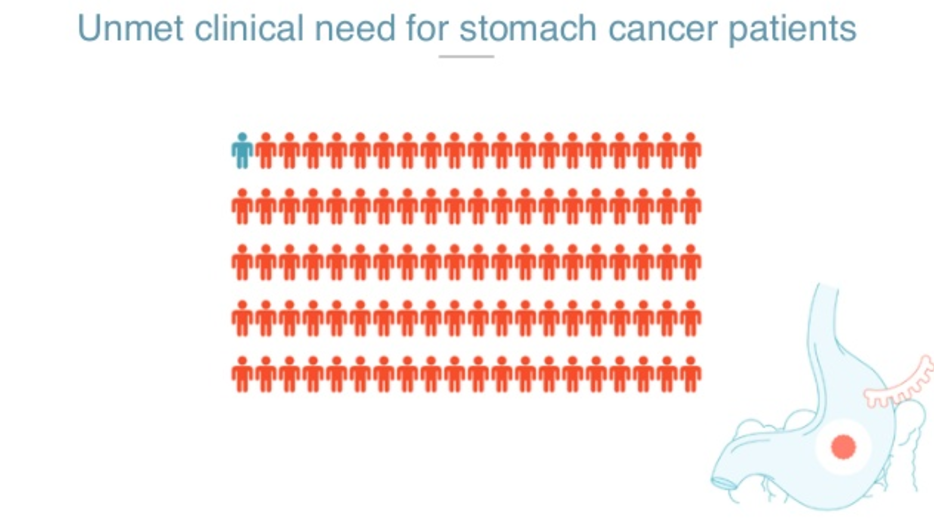
There’s no other biomarker, and the typical diagnostic test that you would be recommended if you have symptoms, is an endoscopy. Out of the people we refer for an endoscopy, only 2% of them will actually have gastric cancer. That means that endoscopies are over-utilized and the lines for endoscopy are huge, especially in countries where gastric cancer is prevalent, such as in Latin America and Asia.
We know that some symptomatic patients wait until as much as four years to actually get an endoscopy. So, the diagnostic problem that we are trying to solve is just to try to clean those endoscopy services so that the people who actually need it get it. We want to do a screening test in which you first get the test, and then you’re referred to an endoscopy if that’s needed. That’s our clinical utility.
Then for the validity, we needed to establish that we can have a politic mode that takes microRNA profiles and spits out the probability of you having gastric cancer with some generalization power.
In order to do that, we joined forces with the NIH and the National Cancer Institute, as well as a very well-known eminence in the gastric cancer community in Chile. We defined very clearly our inclusion criteria, which is, who are the people that are going to end up getting the test? Those who are referred to an endoscopy.
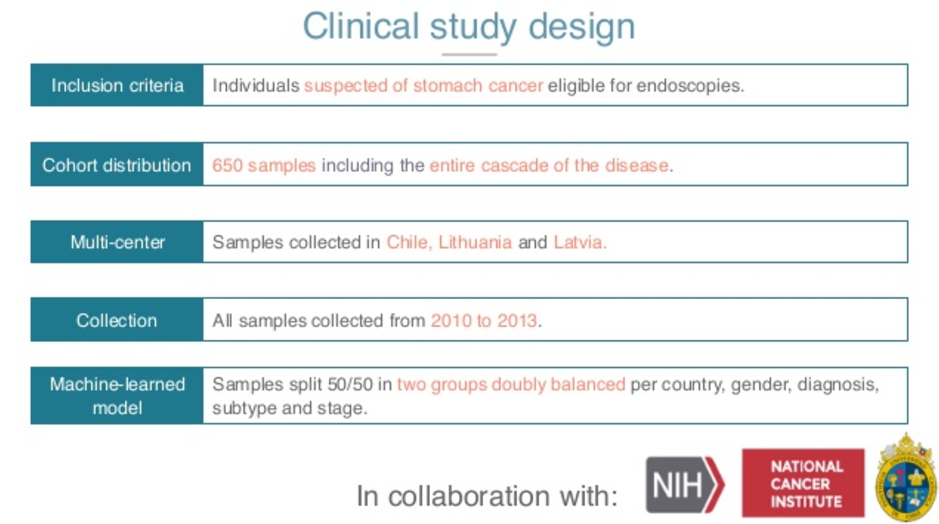
So only people that are symptomatic and are moved over to endoscopy get into the study. The distribution of the study of this in size is the biggest, the largest study of my practice in gastric cancer to date.
We have 650 patients that are distributed across three different centers. We have Latvia, Lithuania and Chile, so different genetics, different hospitals, different practitioners. The collection actually matters, it has to be analytical. We want fresh samples, so 2010 onwards.
Then we applied the strictest way of training these models, so we had half of these data centers try to train our model and evaluate it onsite. We put all these in our machine learning machine and ended up with a model that has an area under the curve of around 0.8, 0.78, where these plots are for specificity versus sensitivity. Here, you can decide to choose a threshold that is maximally useful for our study.
In our case, we know that endoscopies are very specific, but not so sensitive. So we wanted a screening test that is very sensitive and not so specific. The reason for that is you don’t really care that you have some false positives, because these people are going to be referred to endoscopy later.
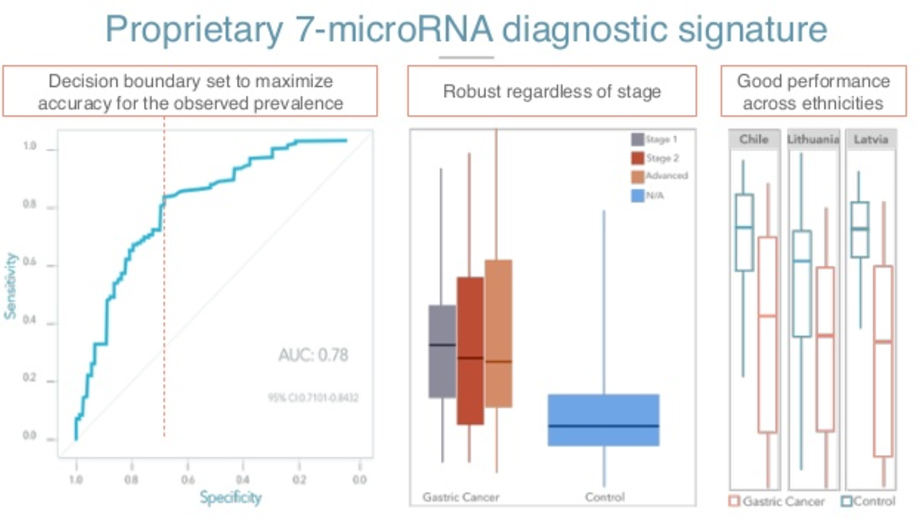
So, we try to maximize our accuracy for the prevalence and the application. We were happy to see that the test performed well on early subjects. The plot in the center is just our risk, of course, for first of all, to the right for the control population, that is people not with gastric cancer.
The uniformly lower levels of the cancer, but also the test predicts well early as well as later stages. And this is important because the people that we actually want to fish are these people with early stages of cancer, in which the prognosis is much better.
Something I forgot to mention is that one of the reasons that gastric cancer is the third most deadly cancer is not because it’s a bad cancer; it’s because it’s diagnosed very late. So if you can actually move the diagnosis from a stage three and forward to stage one, you can greatly reduce the mortality of the cancer.
Finally, looking at this, three different sentences in which we were training this model, we see that the model actually performs well in all the sites.
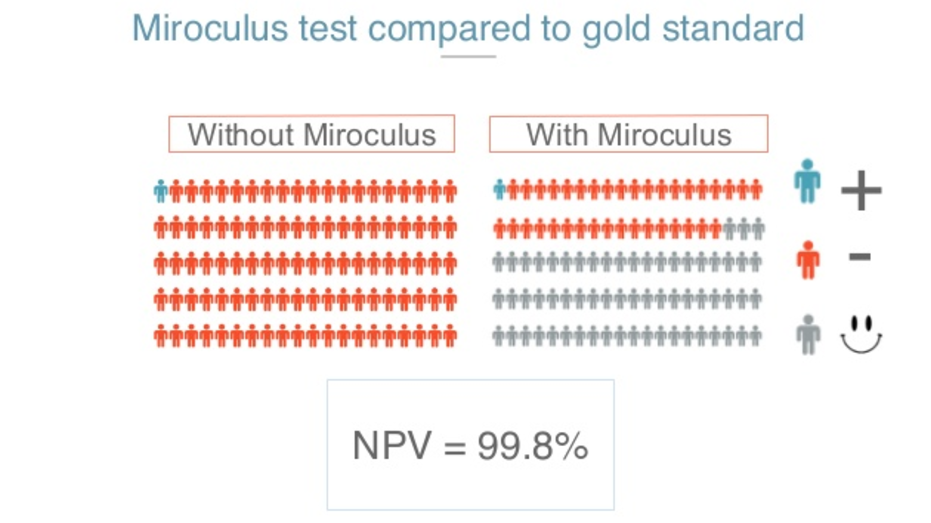
With all this, we think we can solve or at least ameliorate the problem of congested endoscopy services. With all your help, we will say one or 2% of over 100, say out of 100, could have gastric cancer. If we screen with our tests, we expect to be able to still detect these one or two cancers while freeing 60% of that endoscopy area, potentially for people who need it most.
It’s also important for our screening purpose that it is negatively valued. That is the probability of you being sent home because somebody else said that you weren’t being tested, while actually having cancer. So that would be the most common situation, and we know that is 0.2% which is something that is well above what the guidelines for a test like this are, about 95% imperial.
That’s how we foresee the future of diagnostics.
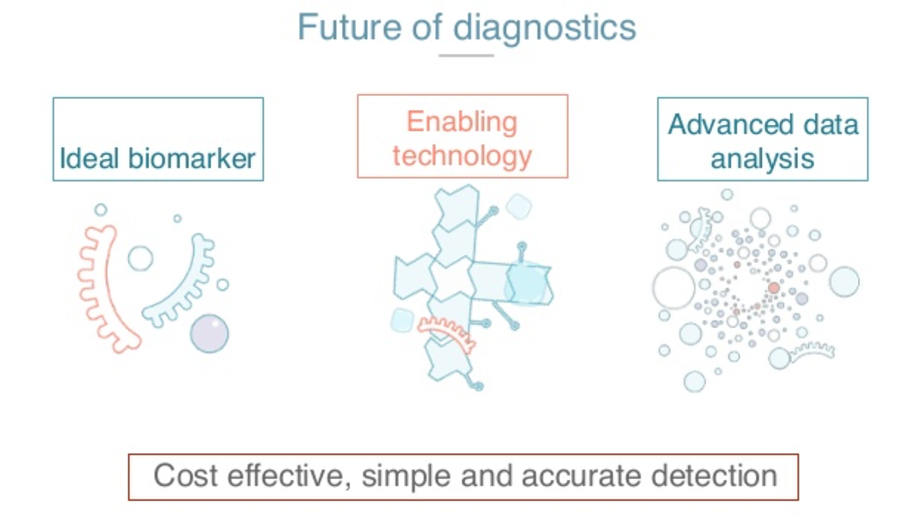
We pair the idea by marker that it’s sensitive enough, specific enough, and articulates lots of them. You can be tested in a minimally invasive way, and enabling technology that makes it possible for us to make a robust, repeatable, and cheap test, and advance the analytics that let us build models that are predictive enough and can be applied in real time on everybody.
With these we hope that we can get cost-effective, simple and accurate detection for everybody for diseases like cancer.
Share Article


Explore
Related Articles

Why healthcare CIOs can’t afford to scale AI without a knowledge graph foundation

How graph intelligence drives breakthroughs in science and society
Finding the fastest way out: How Dijkstra’s algorithm finds shortest paths

Whose signature really matters? Understanding PageRank through yearbook signatures