Semantic PDM: Using a graph data model at Schleich

Semantic PDM Consultant
14 min read
What we’re going to be talking about today is how the German toy manufacturer Schleich uses a graph data model to track all the elements related to toy production.
I’ve been an engineer in Germany for the last 25 years, and spent the last seven years working for Schleich, a German toy manufacturer. They’ve made a lot of famous toys, including smurfs, so many parents are probably already familiar with the company.
In my time there I was responsible for operations, and managed the data that came out of all the different factories. Even though Schleich is a German company, the majority of production is done in other countries such as China and Romania. Every single Schleich figurine is hand-painted, and there’s a lot that happens behind the scenes including logistics, product development and purchasing.
Below is a typical hand-painted Schleich product:

Schleich is, like a lot of other companies, facing a few different emerging challenges. Some years ago the main concern was product conformity. Shortly after that, it was the issue of chemical safety and a chemical risk assessment. There are different softwares that have emerged to address both of these concerns.
Developing our data model
Companies can sometimes be diverted from focusing on product development by struggles managing their data. Three key features that are extremely important for an effective data model are trackability, traceability and transparency. These are crucial for not only the toy industry, but the cosmetic and food industries as well, particularly because they involve regulations surrounding consumer safety.
In creating our new system, we had to be careful to avoid data silos. We did that by coming up with the following system to answer questions that came our way, such as “Are there any critical substances — i.e. restricted chemicals — in this product?” Answering this question effectively requires sorting through a lot of data.

Let’s examine the bearded dragon toy. The first step is to start with the process:
- What was produced?
- How was it produced?
- Where was it produced?
- And what materials were used in its production?
This is something that is normally included in an SAP system but not an Enterprise Resource Planning (ERP) system.
Then you have to go deeper and take a look at the substances on a chemical level, checking for things such as lead and arsenic, which has to be tested in a lab. And the values that are created are subject to legislative rules that put limits on these levels, which also varies based on local context. This requires managing a large number of data chains.
To do that, you need to build up a network of data that is simple, cost efficient, flexible and scalable. There are a number of things you need to consider when building such a network:

The first point, which is very important, is that it needs to be cross-company and collect data across the entire value chain. You need a steady data model regardless of which ERP system you’re using. It needs to be simple to understand and use, scalable, extendable, and have the ability to grow on demand.
And at the end, we need to have all the data available that allows us to answer the questions coming from not only customers, but government officials as well. All of these requirements are the reason we’re not using a relational database model.
Schleich is audited every year with questions similar to the one above. We quickly learned that we needed a concept beyond the already existing systems.
One of our main challenges was to bring together a bunch of languages from a number of different companies:

This includes the language of the ERP system, which covers products and processes, and legislation in the form of lengthy PDFs. You can put these two together and call it a “world of legislation,” which taken together allows you to answer questions from legislators. And then we also have critical substances and chemicals. For those two discrete areas of data, we needed one consistent data model in the middle.
But we weren’t exactly sure where to start. With PDF files, you have to read and analyze the contents, manually extract the data and put it into the data model at least one time.
Developing a Schleich ontology
Why semantics? Semantics is the study of meaning. And how can your data get more meaning?
One of our biggest insights was that there’s an added value of data objects based on their relationships. This means we would have to focus on the relationships, treat them as dedicated data objects, give them a name and make them searchable in our queries and business logic.
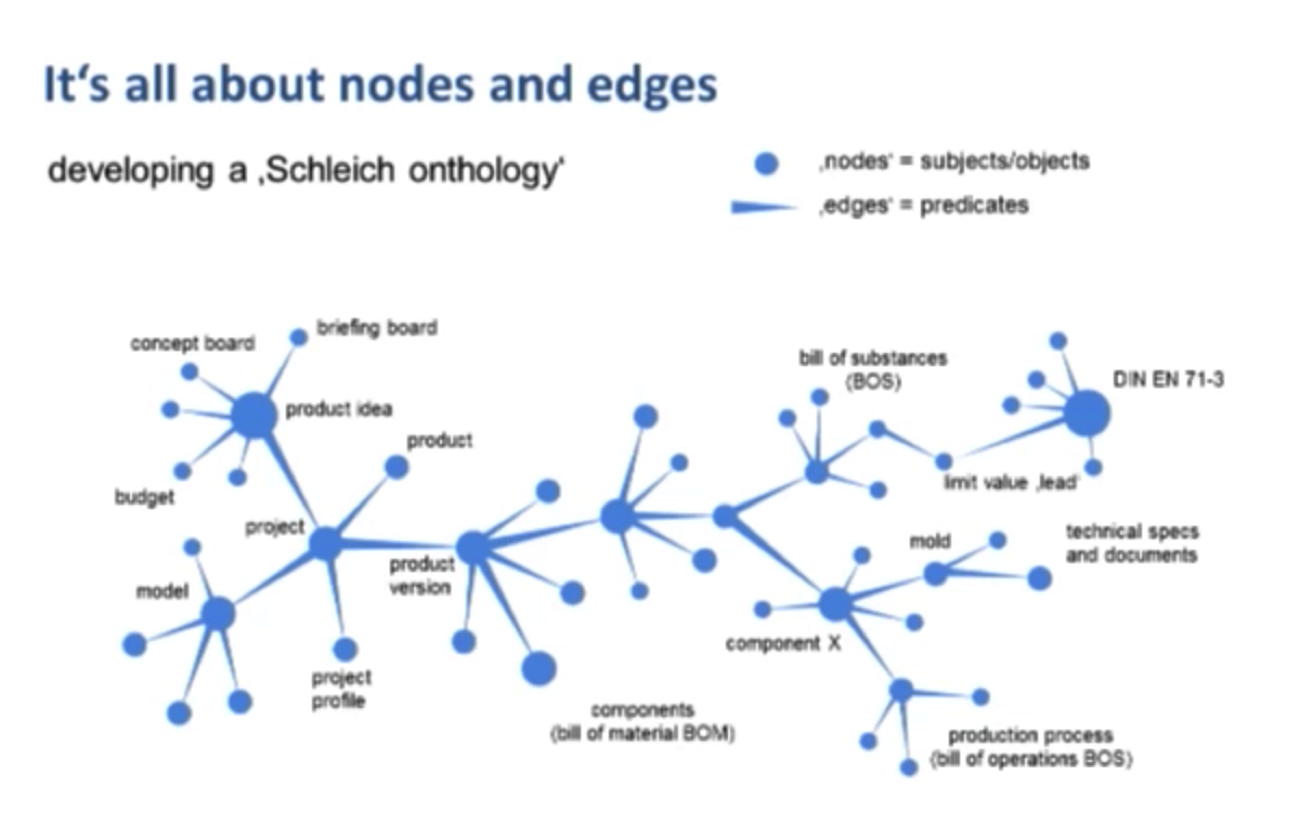
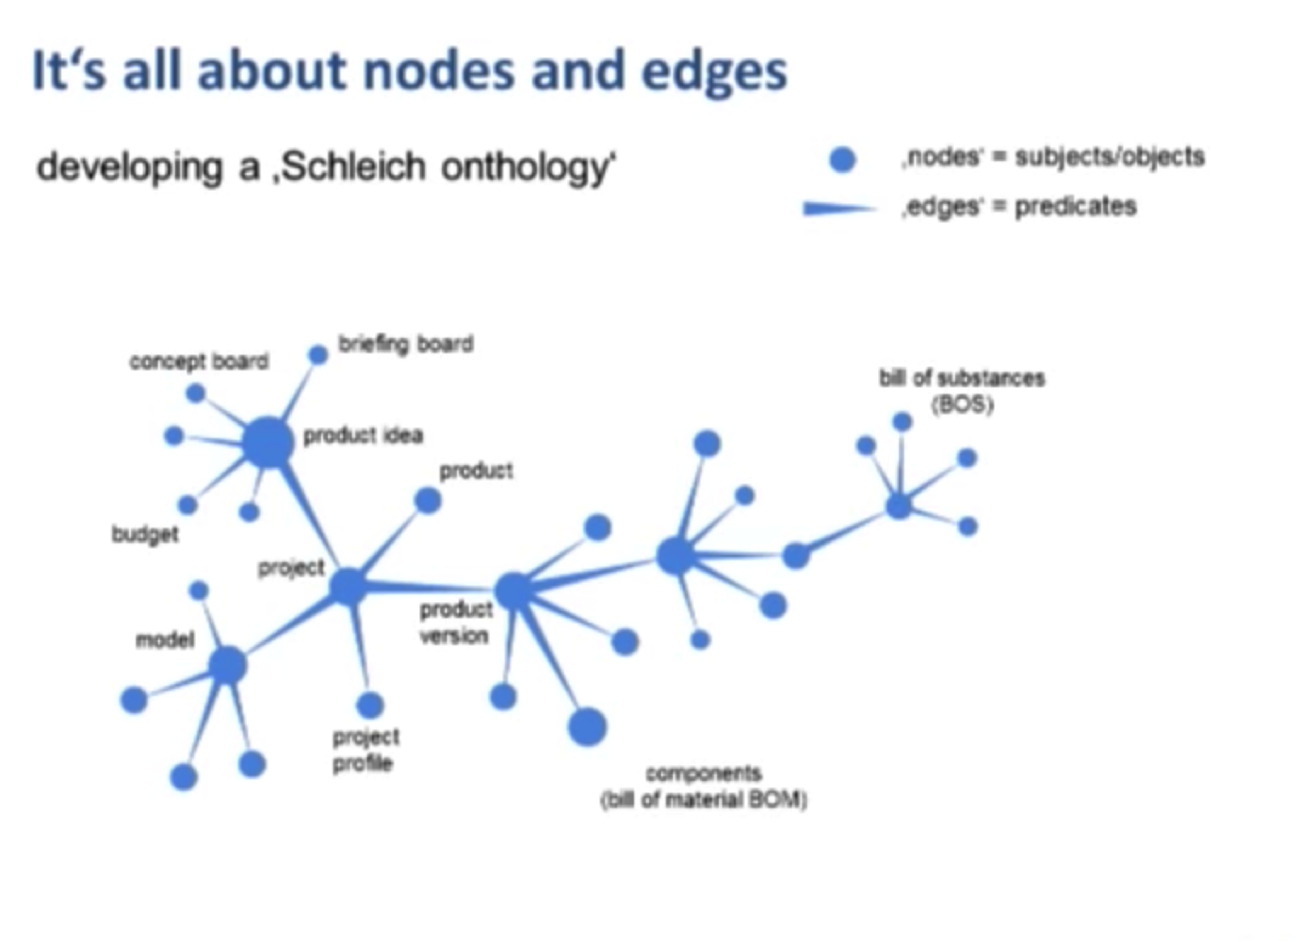
Below is a graph depiction of how Schleich develops a product, from inception to market:

Everything starts with a product idea in marketing in the form of a PowerPoint about the product. We have an existing node — a product idea — to which the team attaches any relevant data.
The first thing we add is called a briefing board, which has additional data on play value, prices and market segments. If this requires an approval, then you come up with a more detailed concept.
All of this data, which are important data inputs for the engineers, was previously lying around on the server in PowerPoint format. But by adding this data as different nodes in the same place, the engineers have access to this important market data to ensure high quality data is available to everyone in the company.
After the product idea is approved, we start a project, the outcome of which is a product. Each project has a number of constraints — including financial — that are included in the data model. We need to start each project with a physical model, such as a horse, to see it modeled by hand or via very specialized software. There is a modeler for each horse model, deadlines and approvals for shape and color. All of these points are connected to the nodes that you see above.
Products that are produced in different countries — such as Germany or China — are considered different products because they require different materials, details and so on.

Then you go one step deeper and say, “This material consists of or has included some substances,” which we call a bill of substance:
If you go deeper into one of those substances, such as lead, the system returns the limit value from the European Toy Safety Directive EN 71.3/3:

If we dive into the more technical corner with components, there needs to be a mold and an injection mold produced, also reachable within that network. And each model has some technical specifications and documents.
At the end, even the production process is part of that system. We end up with a transparent system with a high level of data quality:
The advantage of using semantic PDM
We decided to use a semantic product data management (PDM) system because it allowed us to start very, very small. We started in the Quality Control (QC) department where the chemists developed a new Excel sheet every few weeks without any consistency in the way they named columns. The first step was to develop a Schleich-specific ontology.
After the QC department, we moved on to the technical and product management departments. This involved adding new nodes and objects to be modeled, which was pretty easy to do by using that structure and Neo4j equipment.
Getting an answer from your database
If you are sitting on a product management node such as marketing and you are seeking a technical answer, previously we would call an engineer who would check their detailed Excel sheet to provide a response.
But with a graph data model, the answer is always a path, which is easy to find if you have a consistent model:

When we started, we tried to use the data that was already available in the form of SAP from the Oracle database. To do this, we needed to create connectors with a kind of mapping. We had colleagues in China and Bosnia already working on a system but who didn’t have access to SAP — they were working interactively through Excel via micro applications.
Micro applications
Micro applications with a very dedicated functionality specialize on one thing that happens hundreds of times every day. It’s a very small application, and the data for that application is placed directly online.
We also use a Substances of Very High Concern (SVHC) list. These “watch out” substances are in an Excel file that we imported into our database. We want to then return from our database the bill of materials (BOM) and the bill of substances (BOS).

If you take a look at the typical company, they have several applications with a known database. This is necessary because their application is focused on specific functionalities.
Most companies I talk to try to come up with an additional database — such as a graph database — to handle that metadata. And there are some connections between the data silos and the metadata.

But why not turn this structure upside down?
Really, during the product development process, if you start with creating that data net, you already have a semantic product data management as your base layer. At Schleich, some middleware from Microsoft was introduced for this function. And the packages, the functional focus software products exist, but they have data interfaces via the middleware.

A huge plus is that the document management system was eliminated in terms of documents for product development because we simply attached the necessary PDF, Word and Excel files as nodes in the system.
Our QC department wanted to introduce a Laboratory Information Management (LIM) system. However, instead we were able to meet their needs with micro applications that we designed for this system.

Why not simply use my ERP? Don’t I have everything in my ERP system?
Consider the following example: The nodes in green (below) in my ERP indicate a raw material. But what is a raw material for me is a product for my supplier, and what is a raw material for my supplier is a product for my sub-supplier:

The following two examples show one complete set of data, but from different views. Below is a view of the chain from my company:
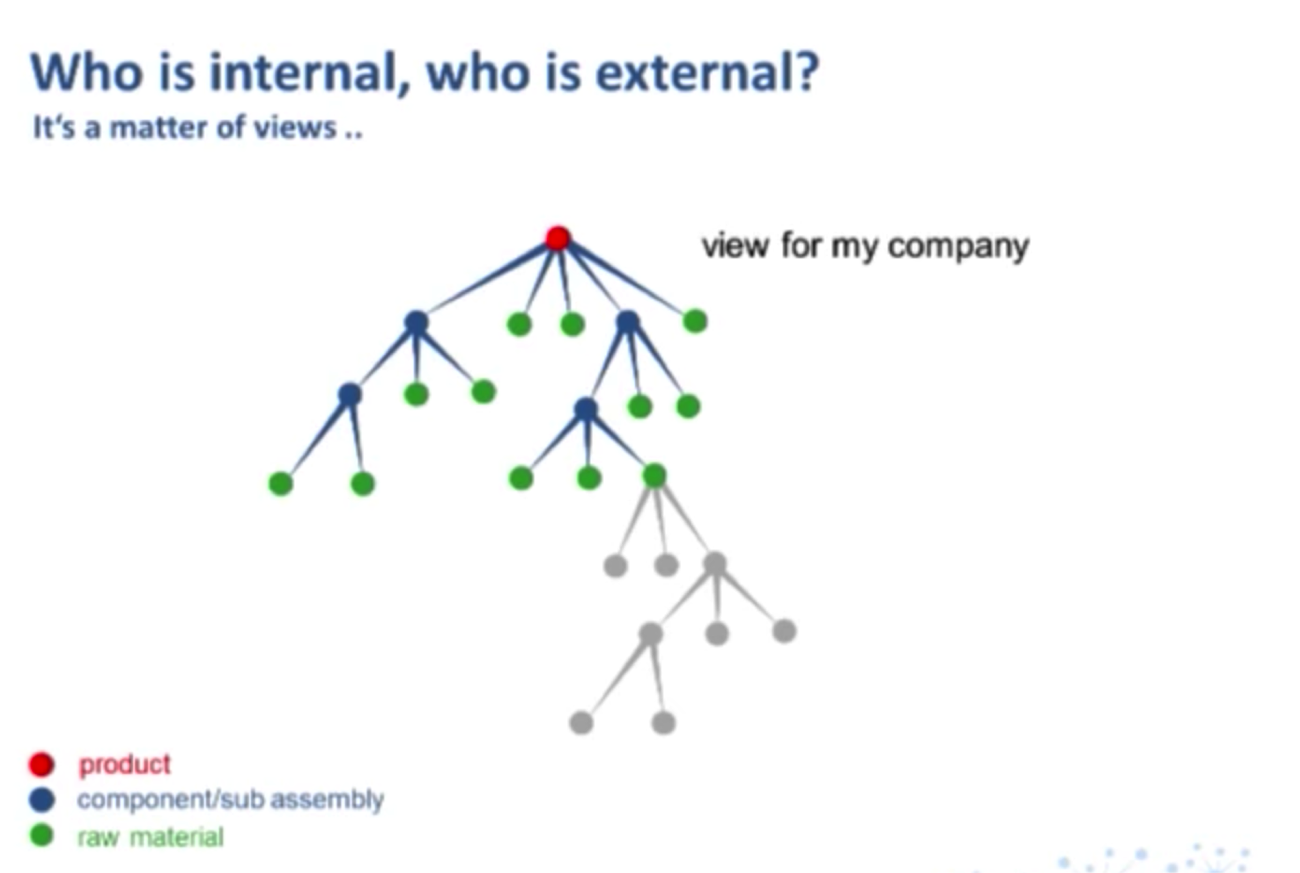
And below is a view from my sub-supplier:

So instead of using our ERP, we use one consistent data chain but change the views. And why does Schleich do this? For a number of reasons.
It’s simple, stable and easy to understand. And while the data for your product will look very similar over the next decade, the way in which you analyze the data — both in terms of process and software — will evolve as new technologies emerge. Processes change, but data stays.
This model is scalable; we started small, but were able to grow it on demand. It’s accessible by our companies regardless of their role or location. It’s incredibly important to work with original data — not a copy — independent from software vendors, hardware and SAP updates. The data is in the middle and can be accessed and manipulated by any software package you’d like.
The model is collaborative and mobile and provides a way to work parallel, independent of time and place, which is absolutely crucial if you have a supply chain located in a variety of countries. And load sharing means special topics, such as the regulatory limit values for chemical substances.
Schleich use cases
Concentrating on relevant data
Below is a screenshot of the Joe Cool, one of the toys produced by Schleich:

On the left-hand side, you can see some product details. On the right-hand side, there are accordian boxes with Cypher queries in the background collecting data from the network. Circled in red is the related registration, Den 73, which gives you the following explaining path when you click on it:
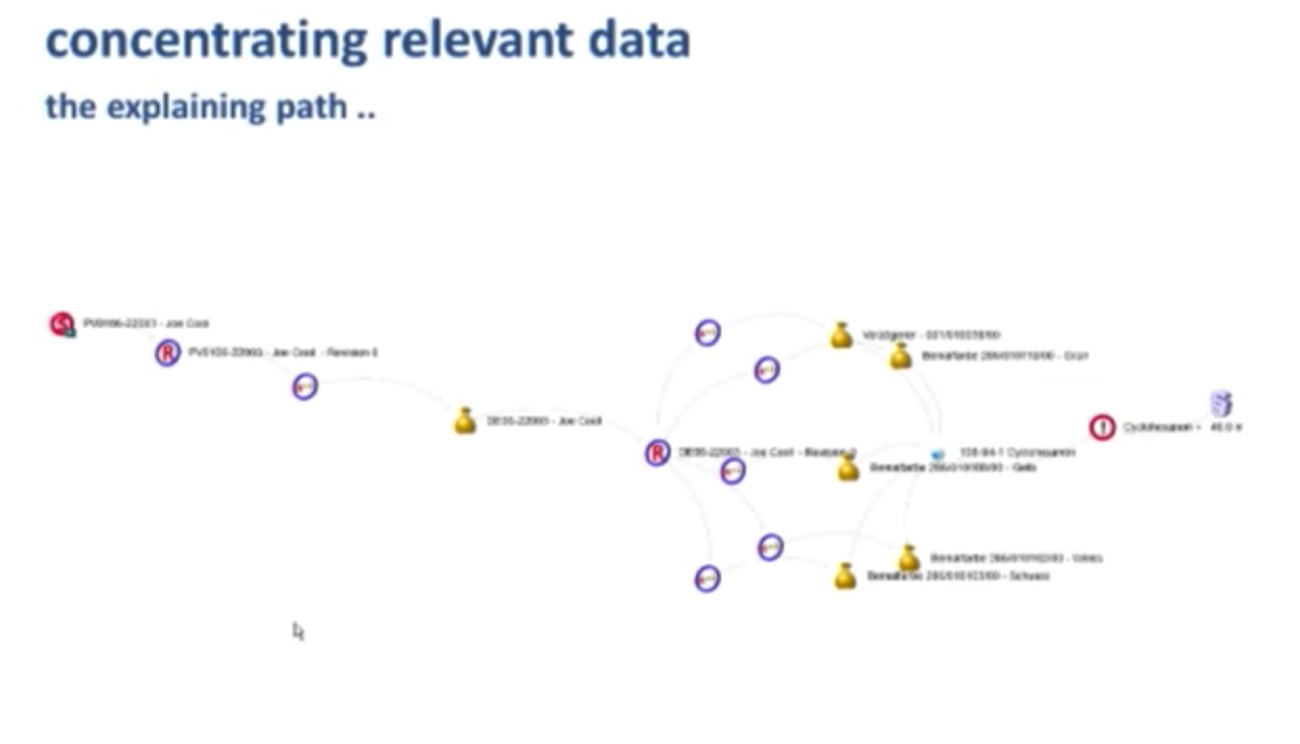
The painting colors used in this toy are shown in the graph, some of which contain the chemical cyclohexanol, a critical substance with a legislated limit value. It’s important to note that this is only one path out of my total network of data, but was the only information that I needed.
Where to place the data
I am often asked by people where to place the data in the database. If I don’t provide an answer, they end up putting it in an Excel that they store on their own computer. This is why it’s so important for your team to understand where to place the data.
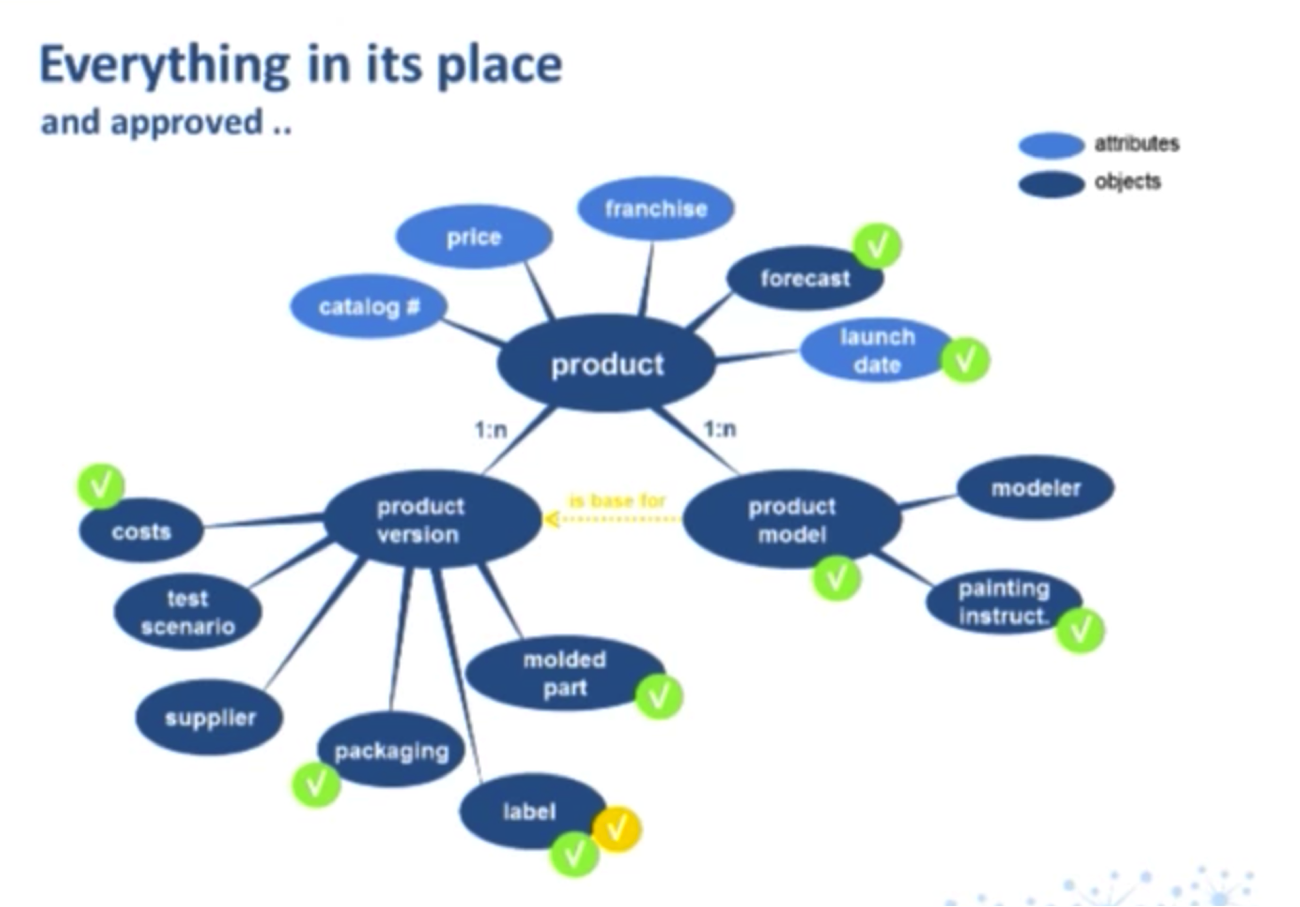
At Schleich, each product has a catalog number and price, along with franchise, forecast and launch data. We also have a 1:N relationship to a product version.
Again, product version is a concrete “made in China” product. Here you can find all the costs, test scenario for QC, suppliers, packaging, label, model and parts. As I mentioned, every product also has connections to the product model, which is the base for product version, and has more details like the modeler, the painting instructions and so on.

Once all the data has been entered into the model, it goes through an extensive approval process. Everything from the launch date to the cost needs to be approved.
Something as seemingly simple as the package label goes through an extensive approval process because all the components — the chemical components of the foil and glue, as well as the barcode — needs to be approved. All of these approvals are indicated with checks below:
Our database also includes an “approvals” tab, which when a node is selected, provides an overview of all its associated approvals:
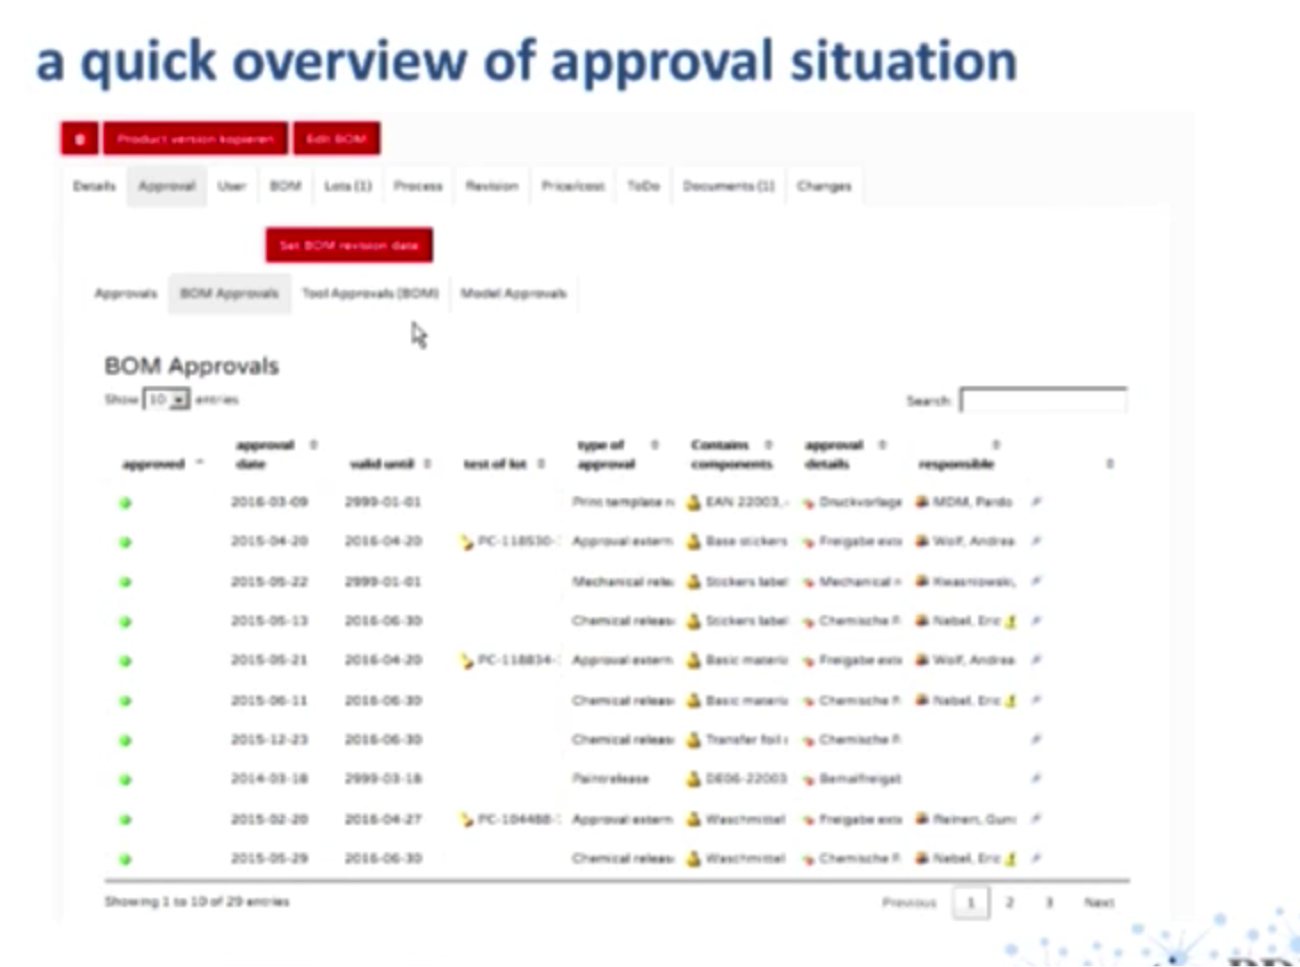
You can go deeper and collect all of the approvals from the materials and colors used in the entire product. The green bubble indicates that that component has been approved. You can then take that green bubble and open up an entire Bill of Materials structure.
On the right-hand side, you see part of that micro-application which we created for entering and managing the BOM data:

Context-based document management
We eliminated document management for the following reasons.
Below we have a “document” node type. Schleich has questionnaires sent in by the suppliers that include a commitment to the products they have shipped to us — pigments, for example. And from now on all the attributes, parameters and additional data connected to those nodes are available to find your document.

If you jump to the supplier or Pigment B, it’s only one click away from your questionnaire document. It’s much better than having a separate document management system with a separate user interface where you have to take care of metadata.
The engineers created a list similar to the BOM approvals list called “working lists” that allowed them to track the launch status of products during a certain time frame, for example, January 2016:

There is a column for launching new products, and you can set a filter to see all the products, molds and injection molds. This is important because if you have a small plastic part being put into a set that was planned to be finished in September, but our marketing wanted it to be launched in July, it will be placed on hold. This is indicated with a red bubble.
Recommendations
Below are a series of recommendations when developing your own user interface:

This worked well for Schleich, and my future work will focus on implementing similar concepts. I hope that other companies will follow this concept as well.
Inspired by Dr. Weber’s talk? Click below to learn more about how Neo4j powers Master Data Management (MDM) solutions at global enterprises with this white paper: Rethink Your Master Data: How Connections Will Define the Future of MDM
Share Article


Explore
Related Articles


1 of 3: The difference between a graph, a knowledge graph, and a context graph

2 of 3: Why graphs, knowledge graphs, and context graphs matter to customers
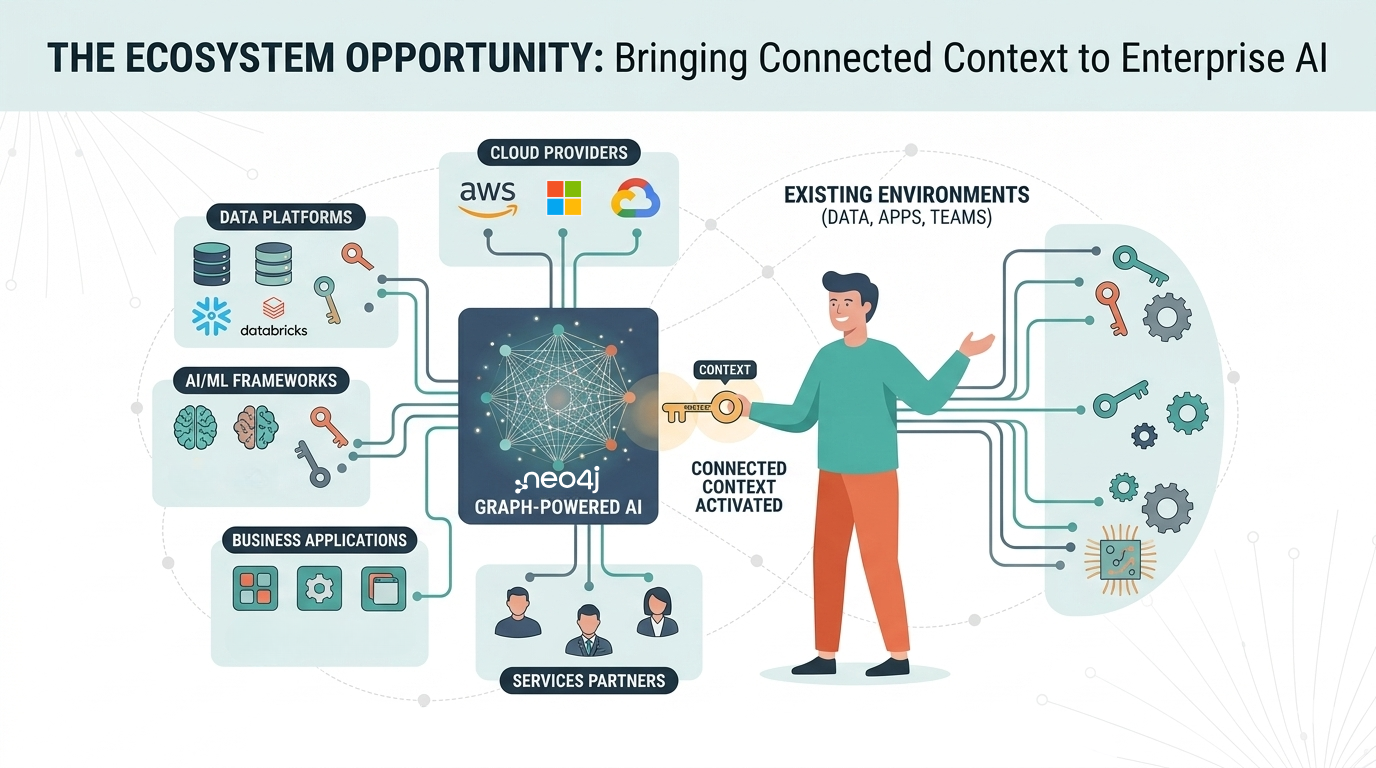
3 of 3: The graph ecosystem: Bringing connected context to enterprise AI
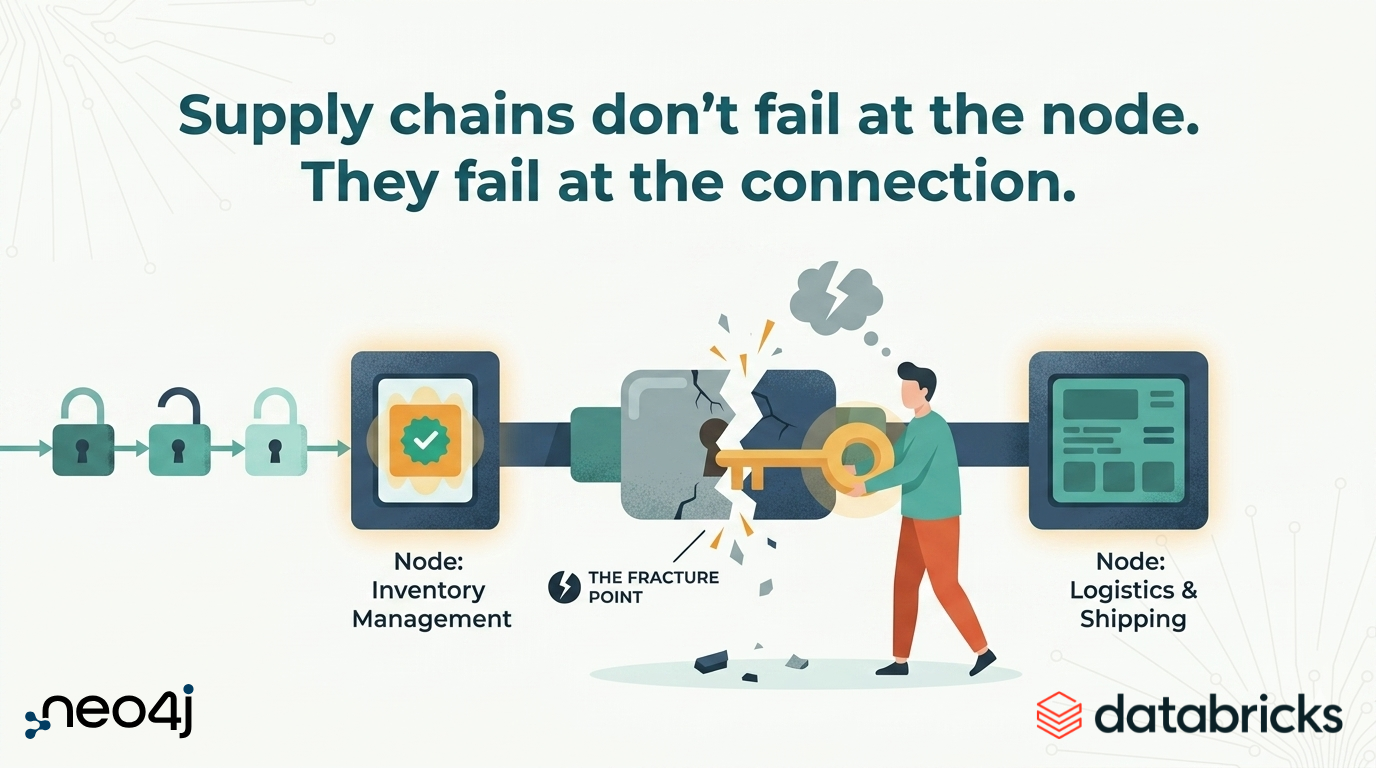
Supply chains don’t fail at the node. They fail at the connection.