Meet SemSpect: A different approach to graph visualization [Community Post]

Managing Director & Co-Founder, derivo GmbH
5 min read
[As community content, this post reflects the views and opinions of the particular author and does not necessarily reflect the official stance of Neo4j.]
Understanding large graphs is challenging. Sure, a proper Cypher query can retrieve valuable information. But how do you find the pivotal queries when the structure of your graph is not known? In this post, I discuss SemSpect – a tool that makes use of a visualization paradigm that allows you to ad hoc visualize and interactively query large graphs to understand, analyze and track your graph data as a whole.
Given a large property graph, how do you gain meaningful insights from it?
For instance, what groups of nodes relate to each other? Are there any characteristics in the network or unexpected connections?
Exploring such patterns can help you realize the overall graph structure and to discover anomalies in the data. Trying to invent Cypher queries to make all those patterns explicit is not always a reasonable solution.
Fortunately, the Neo4j
apoc.meta.* procedures provide some helpful features in this respect. They ship with the optional APOC procedure library available from Neo4j. For instance, to depict the overall structure of a Neo4j graph you can use:
CALL apoc.meta.graph
For the Neo4j dump of the Paradise Papers data from the ICIJ, the result looks as follows:
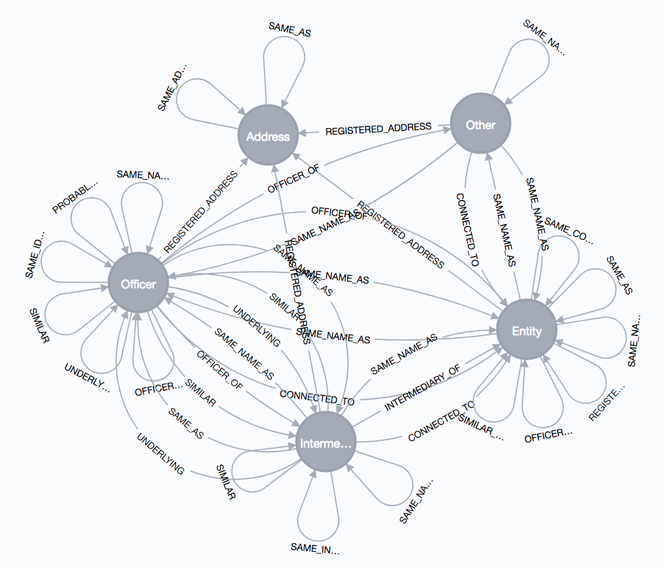
While already helpful, this graph visualization is just a static rendering and does not expose any relationships to nodes of the underlying original graph. Furthermore, one can imagine that this meta graph may be itself confusing in case of more diverse node labels or relationships.
Overview: Details on demand
According to our experience with business-critical graphs, an effective graph dataset needs data-driven exploration and data-sensitive visualization to make sense of large graphs.
Our SemSpect tool aims at enabling even domain and query novices to carry out sophisticated graph research by interacting with a visual representation of the data network.
This data visualization approach is different from commonly known property graph renderings. SemSpect groups nodes by their label and aggregates relationships between groups unless the user asks for details. That difference is key to keeping user orientation and information for large graphs.
Let’s see how this works by playing with the previously mentioned Paradise Papers: consider if a user selects the Officer group as the root of an exploration query (see the image below).
SemSpect depicts this group as a labeled circle showing its number of nodes in the center. The tool guides the user by offering data-driven choices for expanding the exploration graph with the help of a menu to choose a group (called a category in SemSpect) and a relationship for instant exploration.
The expansion choice above will result in an exploration graph – depicted as a tree, spanning from a root group from left to right – showing all officers and those entities to which there is a OFFICER_OF relationship.
As mentioned before, SemSpect aggregates nodes and individual relationships for clarity and comprehensibility. Only when the overall number of nodes of a group is below an adjustable threshold, nodes are shown as gray dots within a group just as displayed for the 39 underlying intermediaries of all officers below.
A number in a particular node indicates the number of related nodes in the preceding group. When selecting a node, its property keys are shown in a dossier and its direct or indirect related nodes in other groups are highlighted (when visible).
Connecting the dots of a graph
A tabular view lists details of nodes on demand as shown in the screenshot below.

To create a custom group of Officers from Monaco we just need to open the tabular view for Officers (1) and search for “Monaco” in the countries column (2). The resulting selection can be applied as a filter with one click (3). As a consequence of filtering the Officer group, all other depending groups in the exploration graph are adapted accordingly.
The Officers from Monaco can now be named and saved as a custom group. There are many more features in SemSpect such as selective filter propagation, reporting, etc., so I’ll have to elaborate in a follow-up blog post.
Fairly complex queries can be built by successively exploring groups or nodes and interactive filtering. Clearly, the query expressivity of SemSpect does not cover all of Cypher. Instead, its specific strength lies in the data-driven guidance while exploring and intuitive filtering options for querying the graph without learning any query syntax.
For those who often poke around in the dark with their Cypher queries, SemSpect is a great tool to explore their graph data, to answer complex queries and to find data quality issues.
If you want to try it by your own for the Offshore Leaks just jump to https://offshore-leaks.semspect.de.
The technology underneath
SemSpect has a Web UI based on HTML5/JavaScript. The Java backend incorporates GraphScale, a technology that can inject reasoning to graph stores such as Neo4j as I briefly introduced in a previous blog post.
This implies that SemSpect can draw on full RDFS and OWL 2 RL reasoning capabilities. However, RDF-based data is not a requirement. We are currently adapting SemSpect such that it can be applied directly to virtually any Neo4j graph database. In such a case, the graph abstraction computed by GraphScale is used as the key index for graph exploration and filtering.
SemSpect for Neo4j launched
As of October 2021 SemSpect is now available as Graph App for one click installation and instant use within Neo4j Desktop. Furthermore SemSpect also comes as a Neo4j server plugin for team usage. Please refer to https://doc.semspect.de/docs/neo4j-graph-app/ for download and details.
Share Article


Explore
Related Articles


A workbench for teams to query, explore, and visualize graph data