
Standard Chartered: Threat Intelligence Using Knowledge Graphs

Vice President, APAC Marketing
7 min read
Editor’s Note: This presentation was given by Hemanth Prabakaran at a GraphSummit 2022.
During Neo4j’s inaugural GraphSummit, we had the pleasure of hosting partners and customers to share insights and stories behind their connected data experiences. We will be featuring more of them in this series of blogs – so watch this space for more recaps.
For the seventh presentation in the series, we’re sharing a highlight from the Singapore stop of the tour. In this presentation by Hemanth Prabakaran – Head Operations, Data Analytics and Insights at Standard Chartered Bank – we learn how the company (which has 85,000 employees, by the way!) uses knowledge graphs to combat both internal and external security threats.
Enjoy! And for more information, please write to me at daniel.ng@neo4j.com.
Standard Chartered Bank has 85,000 employees across 1,200 branches in 49 different markets. At this scale, meeting our diverse customer needs 24/7 globally while securely protecting their privacy is a complex challenge that lies at the core of what my operations, data analytics, and insights team does every day. We’ve mainly addressed this challenge using graphs.
At banks, money is not the only asset we hold. We have many large organizational assets that need to be protected, and since the pandemic started, more advanced cybersecurity threats have emerged to threaten these assets. Within Group Operations, we’re focused on identifying and mitigating these threats.
Data in the Heart of Operations
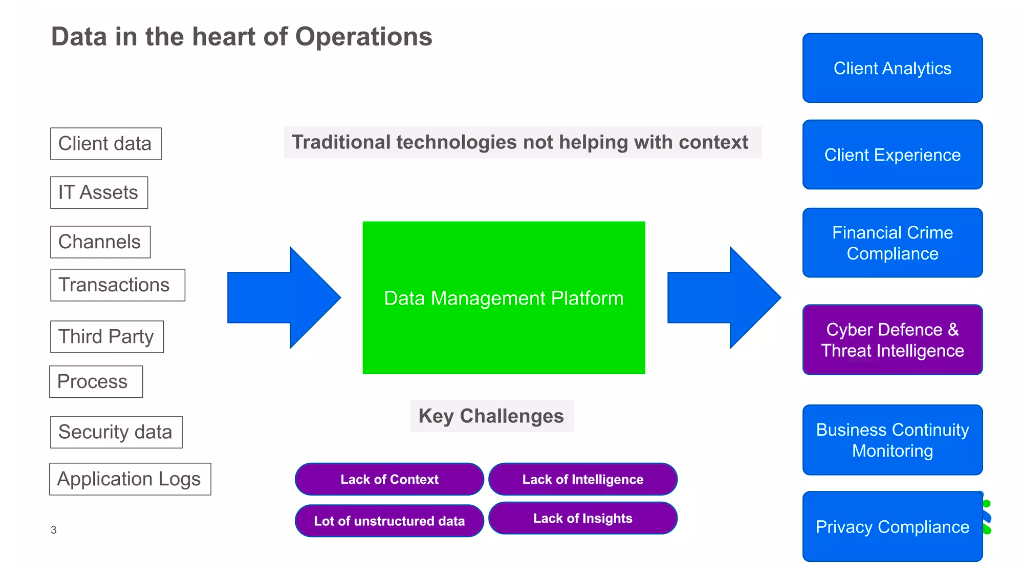
Data is at the heart of everything we do in Group Operations. We started our journey with traditional technologies and have evolved to use advanced technologies to manage huge amounts of internal, client, and asset data every day. As we worked to cope with emerging security threats, we realized we have a lot of insights but were missing contextual intelligence. Traditional technologies were not helping us meet the demands of applying contextual intelligence to our daily operations. To achieve contextual intelligence, we understood it’s not enough just to have data and insights. We needed a representation of what we do within the bank, and that’s when we decided to create a knowledge graph.
It was clear to my team why knowledge graphs are so important and helpful, but because we work at a large organization, there is always pushback when choosing to adopt a technology. The company already has so many different technologies, so how is this one different? What’s the specific need? Before the business could fund these new technology initiatives, we had to answer these questions and be super clear on the value that was going to come out of this project.
Cybersecurity and Threat Intelligence
One area where Standard Chartered was spending a lot of money but still had major room for improvement was cybersecurity. For my team, creating a cybersecurity knowledge graph was a no-brainer because everything in cybersecurity is about intelligence. In cybersecurity I’m not trying to predict something that will happen, what I really need is intelligence that can prevent the threat even before it happens. This makes us prepared for any kind of attack.
Cybersecurity is a massive need for our business. Before the COVID pandemic, we used to have around 20,000 phishing email attacks a day. During the COVID period, there were even more phishing email attacks pouring into the bank every day! Phishing emails are an easy way to compromise the bank’s network, so cybercriminals send phishing attacks to bank employees. If employees click on these emails, they can expose the bank to potential data and asset loss.
The people at Standard Chartered doing cybersecurity defense and monitoring during the pandemic were working hard but were unable to keep up with the massive uptick in attacks. We decided to help them by creating a threat intelligence graph. The knowledge graph would allow our Cyber Defense Center analysts to easily identify more signals to help them find these kinds of attacks before they happen.
Making the Graph Accessible
We use very sophisticated technologies within our cybersecurity team, like Akamai and Splunk, which have been excellent for monitoring; however, these technologies haven’t worked for applying any contextual intelligence to prevent cyber attacks. This is why we added Neo4j to our technology stack. We found that people who needed to use the graph weren’t just analysts but were also less technically sophisticated end users.
One big challenge for these users is that while the data is in graph form and there is intelligence in the graph context, we had to make the tool a user-friendly environment where end-users could consume these insights faster than with traditional querying technologies. Neo4j Bloom has great capabilities to do this, but because we have a really diversified base of end users at the bank, we wanted to accommodate everybody with a super easy end user experience. We decided to take our graph and add a self-service capability on top, where intelligence and insights can be consumed at scale.
We created a tool called a SCypher (not the same as Neo4j Cypher), which is a graph-powered insight engine. SCypher is a no-code knowledge graph ecosystem we created on top of our knowledge graph, and we enabled quite a lot of features for end users. The goal in creating this was to drive more adoption because ease of use is key for adopting any technology.
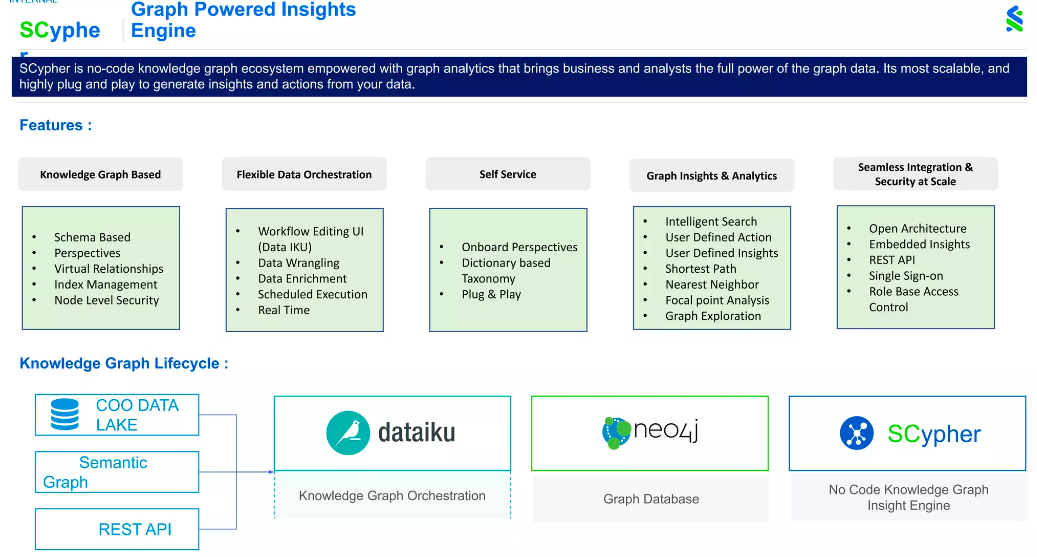
SCypher works by taking data from our data lake, other analytical tools like our Semantic Graph, and other applications like REST API. Then we stream the data into Dataiku. Using Dataiku, we construct the graph using automated pipelines and store the graph in Neo4j. On top is SCypher, our no-code graph insight engine, making this tool intuitive enough to serve not just analysts but all end users.
SCypher allows you to perform a search without coding. All you need to do is click or search. This allows users to create more perspectives and perform more actions, which leads to deriving more insights.
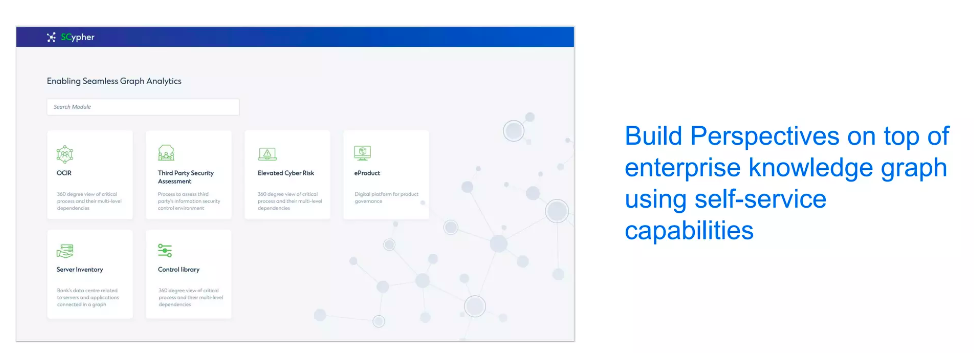
This is how SCypher looks. It is built to scale out for diverse use cases. Every time there is a new use case, a new module is created that addresses that specific use case. We applied SCypher across different areas to make the most use of our enterprise knowledge graph.
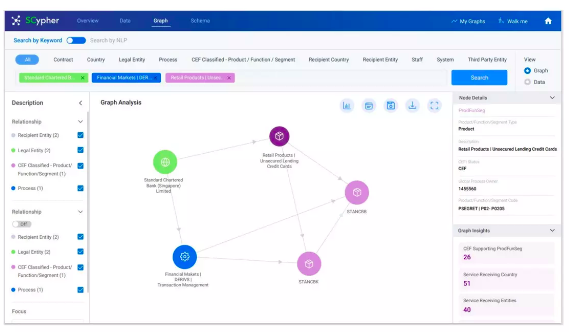
This is another example of SCypher. You are able to choose what kind of perspective you want to build and what kind of insights you’re looking for. There are insights in the bottom right corner, and in the center, you can see the nodes and relationships, where perspectives and actions are also built.
This tool was a massive hit! Before, people were afraid of these new technologies, but by creating SCypher, we took away that fear factor. People love the new technology – they are able to scale more easily and enjoy the ease of use. When we demonstrated this new tool, multiple departments within Standard Chartered came forward to adopt it, including Threat Intelligence, Cyber Risk Identification, Operational Continuity and Resolution, Vulnerability Assessment, Patch Management, Identity Access Management, Data Privacy, and Risk & Control. This meant that once SCypher was set up, we scaled to quite a lot of use cases.
Threat Intelligence Use Case

This is the Threat Intelligence graph, somewhat simplified for better understanding. In this model, the trigger point is employees using tools to detect and report cyber incidents. Here I focus on phishing attacks, but other security incidents can be represented as well. We identify the potential phishing emails from the incidents raised. We need to look at several parts of an incident to identify whether it is a potential attack or phishing incident. The most important feature of the graph predicts this using the domains these emails are sent from. Of course, we do expect external emails to come from our third parties, but we look at whether the third parties are already connected to the bank.
After this, we apply the first level of classification. Based on the external domain, how legitimate is this email? We built a classification model to predict this. It’s a simple classification model based on multiple features and determines if a domain is legitimate or illegitimate. We also built a model to predict if a sender is legitimate, with model inputs based on the email header and the senders’ email address. One of the challenges in our classification models was the large number of false positives found. At the same time, we also needed to make sure true positives were identified with higher accuracy.
When analysts were previously doing this work manually, it took many man-hours to resolve these questions. Exposing all this knowledge in a graph was powerful because it drastically reduced the time needed for the investigation. For example, we also took the email body and came up with a classification of intents. If you look at a phishing email, criminals will use phrases to make you click a particular link. For instance: “Today is the last day to press this particular link.” We use our model to identify these intentions and classify them separately. These models help us find malicious links and attachments.
We also connected all this intelligence to user accounts via our identity and access management tools which connect all our bank’s 1,700 systems. These systems store highly critical information. Instead of just focusing on and assessing an attack, we decided to measure the attack’s impact as well and determine the pattern of the attack. By identifying these patterns, we could prevent these kinds of attacks more quickly than before.
Putting all this information together, our data scientists are able to calculate a threat score using different weightage between all the classification factors we determined. We classify threats as high risk, medium risk, and low risk. Traditionally, people use this threat score to identify phishing attacks, but using a knowledge graph allows us to use contextual intelligence to identify the highest number of true positives.
The most predictive factor was the URL inside the email, predicting nearly 45% of the output. The second most predictive factor was illegitimate domains, allowing us to identify 20% more phishing attacks. It was only possible to use this feature because the graph could use context to derive a threat score, based on the weightage of a threat’s connections. The third most predictive factor was whether the threat email made reference to COVID.
Insider Threat Prevention Use Case
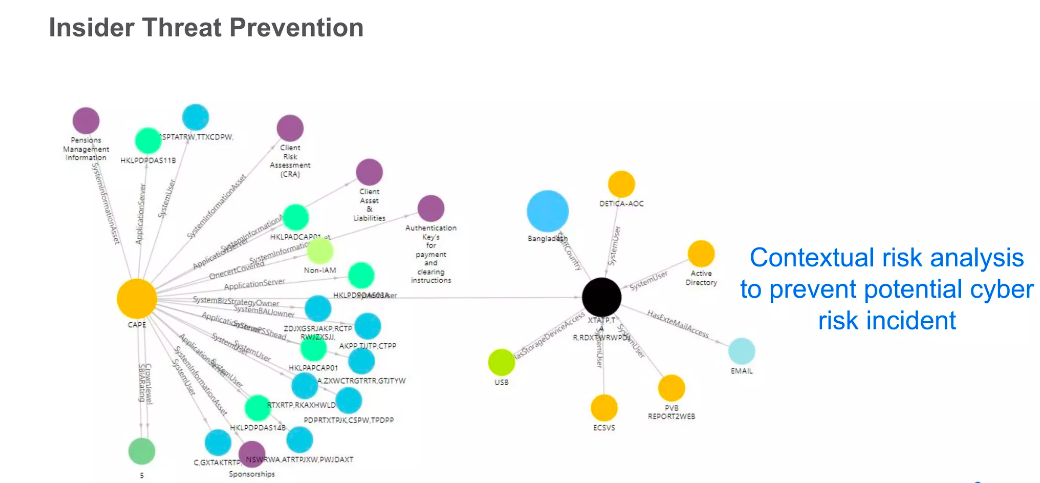
This is another use case around preventing insider threats. Before, employees could get approval to put USB drives on the bank’s network. Since this creates a security risk, we wanted to use a graph to provide more contextual analytics and insights to make sure that we weren’t facing a security risk.
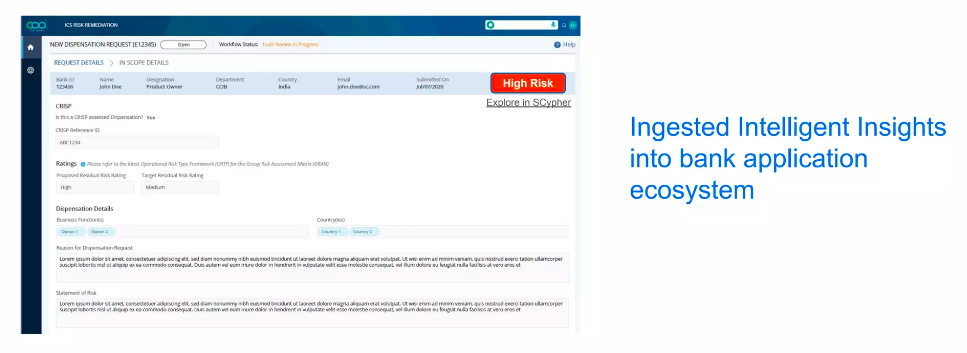
The example above is an employee’s request to access a USB drive. Before, this request was approved only based on the employee’s justification, but now using Scypher, all the relevant context and insights can be taken into account. We can flag the request as a higher risk because searching the knowledge graph raises previously unseen threats. An analyst would be able to click on this screen and see the entire graph, including information about systems access and hosting of critical information assets. This identifies the possibility of data theft or data loss when approving a request.
Tangible Business Benefits of Graphs
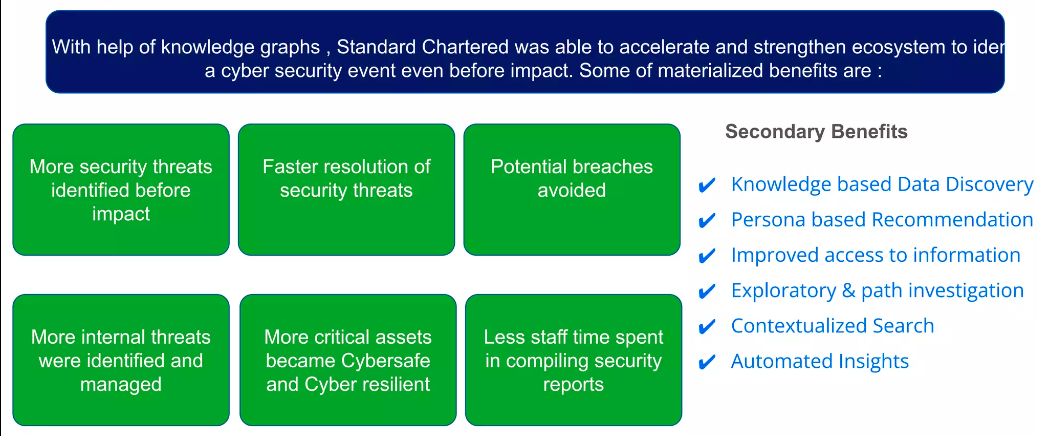
There are many potential benefits to graphs at Standard Chartered, including identifying more security threats before they have negative impacts, resolving those threats sooner, and preventing potential breaches. We’ve been able to use our knowledge graph on Neo4j to continue to expand our use cases and keep our bank safe, while also reducing staff time spent compiling security reports.
Share Article


Explore
Related Articles

Mastering Fraud Detection With Temporal Graph Modeling


How to Improve Multi-Hop Reasoning With Knowledge Graphs and LLMs


