


This Week in Neo4j – Neo4j & Django, Analyzing Genomes, GGCD, Change Data Capture,
5 min read
This Week in Neo4j – The MET Art Collections, Neo4j Path Through the Christmas Holidays, Decoding Covid-19 tweets using NLP and Neo4j
3 min read
This Week in Neo4j – IT Operations and graphs, Building An Election Night Dashboard, Central Park Sandbox
3 min read
This Week in Neo4j – Hierarchical Layouts in Bloom 1.4, Graph Data Science with LynxKite, FullStack GraphQL Book Club
3 min read
This Week in Neo4j – COVID-19 Contact Tracing, Supply Chain Management, What’s new in Neo4j Desktop?
4 min read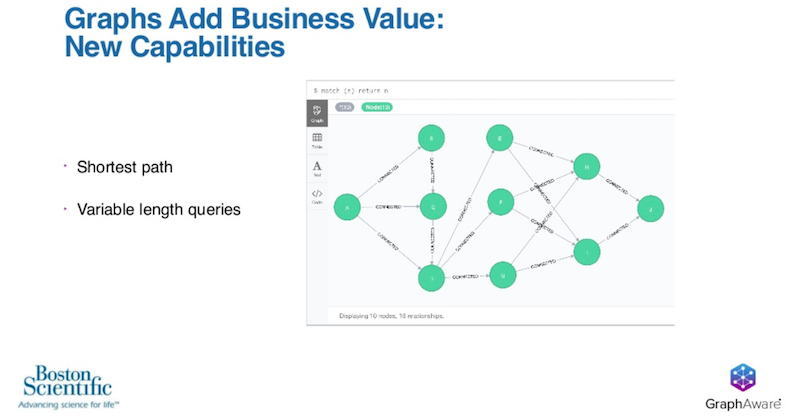
How Boston Scientific Improves Manufacturing Quality Using Graph Analytics
21 min read
This Week in Neo4j – $80 Million Series E, New Neo4j Monitoring Tool, Cyber Attack Graphs, Spring Data Neo4j Tutorial
4 min read