
Telstra’s Neo4j Graphie Award for Excellence in Data Discovery: Why Neo4j?

Vice President, APAC Marketing
8 min read
Editor’s Note: This presentation was given by Harry Corfield at GraphSummit 2022.
During Neo4j’s inaugural GraphSummit, we had the pleasure of hosting partners and customers to share insights and stories behind their connected data experiences. We will be featuring more of them in this series of blogs – so watch this space for more recaps. For the fourth presentation in the series, we’re featuring Harry Corfield, Senior Data Architect, Chief Data & AI Office at Telstra. He spoke about their Graphie Award and shared his experience using Neo4j Graph Database to develop a data knowledge map.
Enjoy! And for more information, please write me at daniel.ng@neo4j.com.
As a data architect, I work with data a lot, and that data is usually distributed all over the place in lots of different silos. At Telstra, we have thousands of applications, products, platforms, and networks that generate data, and it can be hard to get access to the data or even find it. The question we’re asked most frequently is: Where can I find this data? They might know the application name or a business capability or that the data belongs to a process, but it still remains a real challenge to find that data.
If we could bring all those different data sources and pieces of information together into knowledge, people can then find things. About a year ago, I had the opportunity to work on this project and found that this problem is suited to a knowledge graph. We called this the Data Knowledge Graph, and while I won’t necessarily go into technical details in this post, I want to tell you the story of how we built this even as I was new to graph databases and learning Neo4j as we built the project.
Background
I’ve been at Telstra 18 years, and for 13 of those years I’ve been working with data, including six years as a technology manager working with network data. After that, I got an opportunity within Telstra’s Chief Technology Office to set up our Big Data team. When I joined this team I wanted to use my knowledge of data to be more proactive in helping our customers, rather than waiting for them to call us. I did that for about four years, because then Telstra started its Chief Data Office where we do our data governance, data management, and data architecture.
I joined the data architecture part of that team and started looking for better ways to make use of all our metadata. When I started, it was entirely manual to create data flow diagrams or find data. You have to go to application catalogs, data catalogs, registries, application interfaces, specifications and support plans. The idea was if we could collect that data, connect it, and join it, then we would be able to just simply query it.
In the end, I received a couple of awards for this work. In November of last year, I found out I won a Telstra Networks and IT Group executive award for this Data Knowledge Graph project, both for leadership and simplifying other’s work.
I also won a Neo4j Graphie Award. When we first presented our proof of concept to our partners at Neo4j, they were impressed enough by the Data Knowledge Graph to nominate me for their worldwide Graphie Award. I found out in December last year that we won. We’re honored!
Getting Started Building the Data Knowledge Graph
How did we build the Data Knowledge Graph? There are a number of different knowledge graph tools out there, and the question arises – which one do we choose?
Forrester’s 2020 Wave for Graph Data Platforms had Neo4j in the top quadrant as the leader in the space. I saw that and thought: “That’s probably a good place to start. Who doesn’t want to work with the top software?” Then I had to work out which Neo4j product I needed. I chose their desktop client, which is free and provides all the enterprise features.
After getting permission to install Neo4j Desktop on my laptop, I basically had a graph database server and could start to create a graph database. I put in my nodes and relationships using the Cypher language and then used Cypher to display and query my nodes and relationships. I thought this was a great way to start. I’ve been in IT a long time and have built databases in many different systems and many different languages, but I had never actually designed or built a graph database myself before.
Learning Neo4j Fast: Graph Academy & Certifications
After getting started, I wanted to learn Neo4j quickly; I’ve got the tool, so how do I learn how to use it? Neo4j has courses called Graph Academy. It’s free and fairly quick. I started with the Neo4j Fundamentals course and I did it in about half an hour. They have a one-hour Cypher Fundamentals course, which covers the language you need to create nodes and entities and display them. There was also a course on Graph Data Modeling to learn the best way to model my nodes and relationships.
For me, the most important course was about how to import data. A lot of the metadata sources I had, like application catalogs, data catalogs and registries, I could put into a CSV. Then I could write a bit of code to import it in. In fact, when I did the course, I didn’t upload their data for the exercises. I grabbed my data, created the nodes and relationships, and I started querying it.
I found that within one week, I was able to find the tool, install it, learn how to use it, create nodes and relationships, and display them enough to be able to do a showcase for other people to see if this was the right way to go. It was a really quick process, even starting from not knowing Neo4j previously, and I found that it was really powerful.
In my career, I’ve found that when you do courses and then start doing things in your job, you use certain features in that product, but you don’t necessarily know the breadth of the features available to you. I found that vendor certifications force me, apart from the training course and what I’ve done, to learn more about all the features available. I did the Neo4j Certification about two months after starting and it helped me. We also are talking about graph data science and I found that certification useful to see what we could use in the future.
Importing CSV Data Into Neo4j
I’m going to give you a couple of brief code samples of how to import data into Neo4j. Doing it this way made it quick and easy to create nodes.
I’ve got a CSV of information, and I want to create the application nodes or other nodes in there.

There are a couple of lines of code here that say how to load the CSV and create some nodes, merging them into the database. If you’ve got new data coming in, you can create it without creating duplicates.
The second example is creating the relationships:
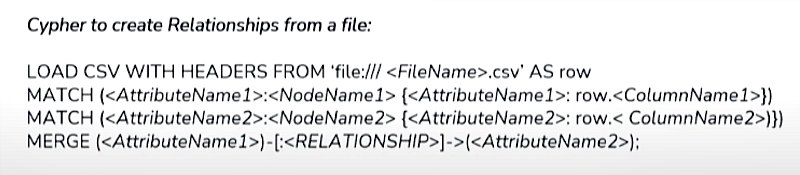
I have a file that I use to create relationships. These examples give an idea of the Cypher code to create nodes and relationships within the database. Again, I was able to do this within the first week.
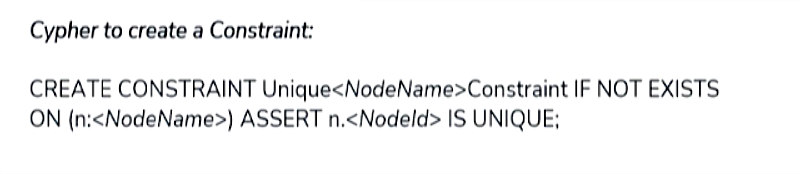
Creating Constraints and Indexes in Neo4j
When you’re building up your nodes, you don’t necessarily want duplicate data. So what you can do is create a constraint first and say this is the unique value for each node to prevent duplicate data.
Later on, once I was adding hundreds of thousands of records, performance became important, so I created an index to make it easier to find the nodes I wanted.

Having an index means that in queries you can find entries that you want and display them on the screen a lot faster. Some of my queries were initially taking a couple of minutes, but once I put the index on, they were taking only seconds again.
Displaying Nodes and Relationships in Neo4j
In this example, I have data, nodes, and relationships. How do I query them?

This is a basic query using the Cypher language. In these queries, you do a match, saying I’m looking for these nodes and they might have these attributes. To display it on the screen, use the return command.

This query is bringing in not just certain nodes, but also the available relationships. When I generate a data graph, it can have lots of different relationship types. Oftentimes, I’m looking for a specific relationship; for instance, in our Data Knowledge Graph I look for which data platforms the data goes to. This query uses the simple Cypher language, which I found easy to learn because of my background in relational databases and SQL.
A number of our data analysts don’t know SQL because they use data visualization tools like Power BI or Tableau, which allow them to click and just drag and drop to find what they want. Neo4j has a no-code exploration product called Bloom, where people can just type what they want to see in English on the screen and then the nodes appear on the screen. They can look at node properties and expand the relationships. We’re looking at adding Bloom for our non-technical analysts so they can explore the data without having to write queries.
Useful Resources: Neo4j Documentation, Community & Stackoverflow
When I was learning Neo4j for the first time, I found helpful resources. Neo4j has all their documentation online, including documentation on the Cypher query language. If you’re trying to work out how to do a particular, complex query, this is the best place to learn.
Neo4j has a community online, which I’m a part of. People put up questions, then other people in the community answer them. You say, “I’m trying to do this” or “I’m getting this error,” and people will respond and make that answer available. I found this very useful and have even helped out a few people in the community myself.
Neo4j is also on Stack Overflow, which actually has more tagged Neo4j questions than the Neo4j community. I found a lot of the answers I was looking for there.
Best Practices
My best advice for getting started with Neo4j is to start small. At Telstra, we typically break down a project into one or two week sprints. Working on a one week sprint, I would add a new feature to the knowledge graph and would showcase the feature to some people to get their feedback about whether they liked it or if they wanted to add something else. That request would go into the next sprint.
It’s really valuable to show people your graph and have them say: “This is what I want” or “Could you add this?” I found people would then tell their colleagues about the project, which would bring in more people who were trying to find data and have good feedback to incorporate into the knowledge graph.
Share Article


Explore
Related Articles

How to Improve Multi-Hop Reasoning With Knowledge Graphs and LLMs


