
This Week in Neo4j – 3.4 and Bloom Announced, Analyzing Wifi Traffic, Text Analysis using Graph Visualization, Azure Functions

Developer Relations Engineer
4 min read

Welcome to this week in Neo4j where we round up what’s been happening in the world of graph databases in the last 7 days.
This week we have the announcement of Neo4j 3.4 and the Bloom visualization tool, analyzing Wifi traffic, gaining insights into text using graph visualization, Neo4j with Azure Functions, and more.
Featured Community Member: Dmitry Paranyushkin
This week’s featured community member is Dmitry Paranyushkin, Senior Researcher at Nodus Labs.
Dmitry Paranyushkin – This Week’s Featured Community Member
Dmitry has been in the Neo4j community for a number of years, and started using Neo4j in the 1.9 series back in 2013. Dmitry used Neo4j to build InfraNodus, a tool that can be used to easily gain insights from text using graph visualization.
Dmitry showed off InfraNodus during this week’s online meetup.
The tool uses sigma.js as its visualization component.
For almost the entire hour Dmitry did a live demo of the tool and showed off its voice to text to graph feature, as well as how to analyse the text of Wikipedia pages and Twitter hashtags.
The tool is available on the noduslabs/infranodus repository, so give it a try and let Dmitry know how you get on.
On behalf of the Neo4j community, thanks for all your work Dmitry!
Oh…and watch the video, it’s amazing!
Neo4j 3.4 and Bloom Visualization Tool Announced
On Tuesday, at GraphTour San Francisco, Emil announced the arrival of an entirely new product being added to the Neo4j Graph Platform: Neo4j Bloom.
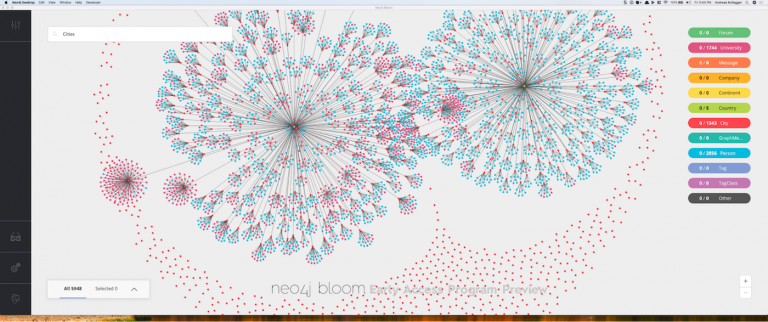
Bloom is a graph communication and data visualization product that aims to make it easier for non Developers to explore and make sense of graphs in the same way that Cypher did for non Java Developers.
Emil also announced Neo4j 3.4, which will be released in the next few weeks with native support for Spatial and DateTime data types. We’re looking forward to see the new applications you’re able to build with the new functionality.
You can watch a recording of Emil’s announcement as well as a live stream from the whole of the GraphTour San Francisco event.
A.R. Guess also has an article covering the release announcement.
Release of GraphAware NLP Libraries, Azure Functions, Plotting Wifi Traffic

- Roy Bailey has written a post in which he shows how to import data into Neo4j graph database with APOC. Roy wanted to hydrate and join data from approx 20 sources on a regular basis into an embedded Neo4j store and was able to use APOC‘s JDBC and periodic iterate procedures to get the job done.
- GraphAware have upgraded their Graph-Based Natural Language Processing modules for Neo4j. There’s more than 60% performance improvement, custom NER and better keywords. You can download the latest version from products.graphaware.com
- In Chris Skardon‘s latest post he shows how to write an Azure function that executes a Cypher query against Neo4j.
- bitsrot shows how to use Neo4j to graphically plot and analyze the relationships between Wi-fi nodes using the air around us. Python and scapy are used for packet capture and Cypher is used to explore the dataset. You can try find the code from the post in the bitrot-sh/wispy repository.
Graph Analytics vs Graph Queries, Neo4j and Java, Data Viz in Mixed Reality

- Dan Woods attended and spoke at the GraphTour Washington D.C. event and has written an article in which he wonders what the difference is between graph analytics and a really good graph query? Dan discusses the three levels to graph analytics – graph queries, graph algorithms, and finally graph analytics – and shows examples in each category.
- Amir Bozorgzadeh has an interesting article about data visualization in mixed reality, and Kineviz’s GraphXR platform gets a mention for being used to explore Russian troll data.
- Steven Haines has written the 2nd part of his series covering Big data analytics with Neo4j and Java. In this post Steven shows how to get up and running with the Java driver, explains the way all the pieces work together, and shares sample code for building a social graph based application.
- Colin Fay shows how to import Twitter data into Neo4j and analyse it using the RNeo4j driver that he recently started working on.
Next Week
What’s happening next week in the world of graph databases?
| Date | Title | Group | Speaker |
|---|---|---|---|
|
May 8th 2018 |
Neo4j and Customer speakers |
||
|
May 8th 2018 |
Vlasta Ku |
||
|
May 9th 2018 |
Uncover Opportunities and Mitigate Risk with Neo4j & Thomson Reuters Data |
||
|
May 9th 2018 |
Tweet of the Week
My favourite tweet this week was by my colleague Oskar Hane:
Playing around with presenting the new geospatial datatype in query results in neo4j-browser. pic.twitter.com/nz5JoW66k9
— Oskar Hane (@oskarhane) May 3, 2018
Don’t forget to RT if you liked it too.
That’s all for this week. Have a great weekend!
Cheers, Mark
Share Article


Explore
Related Articles

This Week in Neo4j: GraphRAG, GraphAcademy, Knowledge Graphs, Symfony and more

This Week in Neo4j: Certification, Developer Tools, GraphRAG, Knowledge Graphs and more

This Week in Neo4j: Certification, Graph Analytics, Agentic AI, Knowledge Graph and more


