This week in Neo4j – Building spatial search algorithms for Neo4j, Colruyt data science assignment, GR-R-ANDstack, releases of APOC and Halin

Developer Relations Engineer
5 min read

Hi graph gang,
In this week’s video from the NODES 2019 conference, Craig Taverner demonstrates a new library that we’ve been working on to prototype new spatial algorithms.
Tomaz Bratanic builds a graph analytics pipeline to explore the transport system in Rome, Rik tries out the Colruyt Data Science assignment, and Christian Miles shows off the ReGraph toolkit.
We also have releases of APOC and Halin, as well as a brand new Graph App called Neomap, a Neo4j Desktop application for spatial data.
Enjoy!
Cheers,
Mark Needham and the Developer Relations team
Featured community member: Satoshi Mayumi
Our featured community member this week is Satoshi Mayumi
Satoshi Mayumi – This Week’s Featured Community Member
Satoshi is a graph-addict who initially became intimately involved with the graph community via one of our most active community members, Koji Annoura and Mr. Yukiya Hayashi.
Similar to his friends in the local graph community, Satoshi has a strong passion for helping the rest of the world see the benefits of graphs. So much so, that a couple months ago, he submitted a project for GraphHack – Bayron – a React component to visualize Neo4j graph as a Media. What struck us about his submission is that he specified that why he was building this project: “the reason why I created Baryon is that I wanted to show the power of graph to ordinary people.”
Satoshi is driven by his motivation to share knowledge with others and sets aside his time to enable that. We are so grateful for his passion and are looking forward to seeing a lot more from him in our community!
Thanks, Satoshi, we’re so thankful for you! We can’t wait to see what’s more to come!
NODES 2019: Building spatial search algorithms for Neo4j
This week’s video from the NODES 2019 conference is Craig Taverner’s talk about spatial functionality in Neo4j.
In the talk Craig builds on the Going Spatial in Neo4j 3.4 GraphConnect 2018 talk that he co-presented with Will Lyon.
We learn how to write our own spatial algorithms for more complex analyses and how to integrate them into a web-app through user defined functions accessible with Cypher queries. Craig also demonstrate a new library we’ve been working on to prototype complex spatial algorithms within Neo4j.
Building a graph analytics pipeline in Neo4j to explore the transport system in Rome

Tomaz Bratanic uses the graph algorithms library to analyse Rome’s transport system.
First Tomaz explains how the recently introduced relationship de-duplication feature works. He then shows how another new feature – support for multiple relationship types – can be used to find the shortest path based on different modes of transport.
He concludes by building a graph analytics pipeline that makes it easy to run centrality and community detection algorithms over the dataset.
Releases: APOC, Halin, Neomap
This week we had releases of two prominent projects in the Neo4j ecosystem, as well as a brand new project.
David Allen released version 0.12.0-beta of Halin, the open source monitoring tool for Neo4j. This is the first version of Halin that supports Neo4j 4.0 milestone releases. David is so 2019 that he announced this release via a twitter thread.
Halin v0.12.0-beta was just published, and open source monitoring tool for Neo4j. Biggest new thing? Support for Neo4j 4.0 milestone releases! Want to know more? Thread ? pic.twitter.com/Vu2TbxbiKC
— M. David Allen (@mdavidallen) November 20, 2019
Jennifer Reif and I released version 3.5.0.6 of APOC, Neo4j’s standard library. This release contains streaming support for the export JSON and GraphML formats, new string multiplication and fill functions, as well as bug fixes. Learn more in the release blog post.
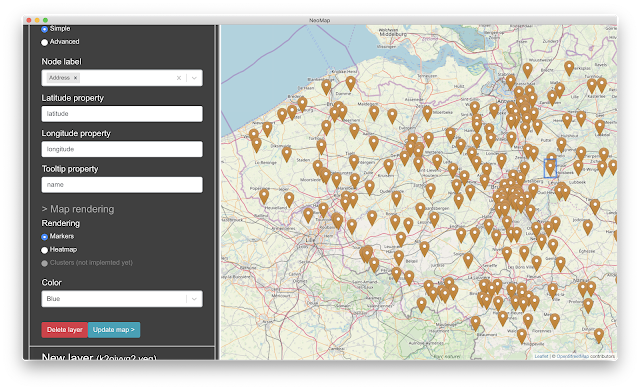
And last but not least, Estelle Scifo wrote a blog post introducing Neomap, a Neo4j Desktop application for spatial data.
Playing with the Colruyt data science assignment
Rik came across Dries De Dauw’s take home assignment for data engineering candidates and decided to play around with the assignment dataset in Neo4j.
Rik takes us on a journey in which he shows us how to:
-
Import the data using APOC’s
apoc.load.jsonprocedure - Analyse it using Cypher queries
- Visualise it using Estelle Scifo’s Neomap Graph App
You can find the data and scripts in a GitHub gist that Rik shared.
GR-R-ANDstack (the 2nd ‘R’ stands for ReGraph)
Cambridge Intelligence recently launched ReGraph, a React toolkit for graph visualization.
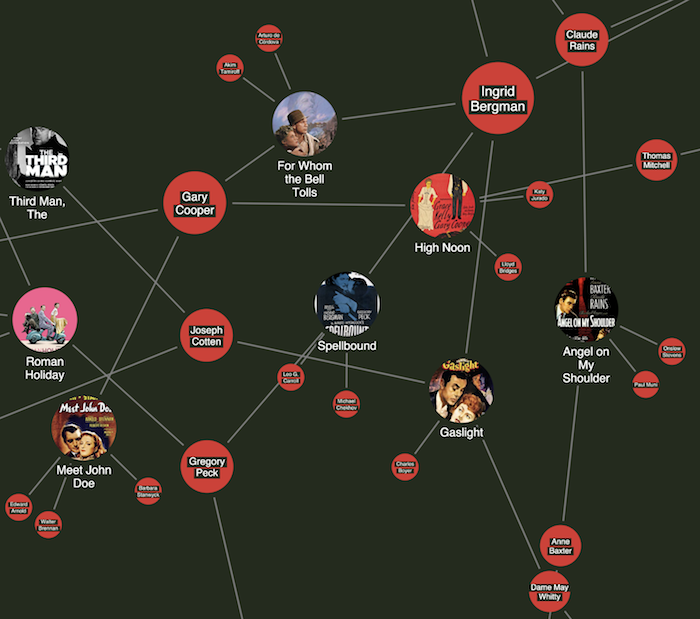
In this blog post Christian Miles explains how to use it as part of a GRANDstack application that explores the Women’s World Cup Graph.
Tweet of the week
My favourite tweet this week was by Andreas Steffen:
final commit for today. getting closer to our MVP. folks filled neo4j graph with biorxiv publication nodes and semantic similarity edges. tomorrow we’ll be pluggin it all together. #bh2019europe @AnilBey @kpj_py @t_teogene @coldc0de
@yeysus
@larsjuhljensen
#quackquacktired pic.twitter.com/OGdrFm4nct— Andreas Steffen (@creatules) November 20, 2019
Share Article


Explore
Related Articles

This Week in Neo4j: Knowledge Graph, Life Sciences, GraphRAG, NODES, Startups and more

This Week in Neo4j: GraphAware, Architecture, Knowledge Graph, AI Agents and more