
This Week in Neo4j – Data Import using RxJS, GOV.UK Knowledge Graph, Analyzing ArXiv data

Developer Relations Engineer
3 min read
Hey graphistas,
I hope your week’s going well. I’ve been playing around with the GDSL’s Pregel API, which provides a vertex-centric computation model for writing graph algorithms. I’ll write something up on my experiments soon.
We’re getting close to the NODES 2020 virtual conference on October 20th, and Karin Wolok and Reshama Shaikh have both written blog posts that will get you excited if you aren’t already. Reshama explains what tech communities around the world are looking forward to and Karin gives us the low-down on what to expect on the day.
Content-wise, we have an excellent video explaining graphs in life sciences, Adam Cowley shows how to import streams of data, and the GOV.UK team explain the graph to rule them all.
Featured Community Member: Oleg Nikolsky
This week’s featured community member is Oleg Nikolsky, Services Application Developer at DXC Technology.
Oleg Nikolsky – This Week’s Featured Community Member
Oleg has been a part of the Neo4j community for a couple of years and is a regular on the Neo4j community site. Month after month Oleg ranks in the top 10 on the Neo4j Ninja leaderboard, which tracks the number of questions that members have helped with.
He keeps a sharp eye on the Neo4j Developer Blog, and this week pointed out that Karin Wolok had undersold NODES 2020 as having 9 hours of content when it has almost 50 hours! We’ve sorted that blog post out now, so thanks Oleg!
Oleg recently started a Masters Program in Data Science at the University of Michigan, and he’s hoping to sneak in a bit of Neo4j (and maybe convert some of his classmates?!). If you have any ideas for cool projects, do let Oleg know on LinkedIn or the community site.
TWIN4j Featured Member Nominations

On a brief side note, we are looking for nominations for future featured community members.
So if you know someone who’s doing cool stuff with Neo4j, be it a colleague, a friend, or even yourself, please let me know by filling in the form below. If you provide your name, we’ll make sure to mention you when we do the write-up.
Graphs in Life Sciences – The Cure for Connecting Complex Data
Our video this week comes from a webinar by Rik van Bruggen and Kristen Langendor about Graphs in Life Sciences.
In the first half of the talk, Rik gives an overview of graphs and graph databases, before explaining how they can be used for contact tracing of COVID-19. Kirsten then talks about her experience working on Covid-Graph, a research and communication platform containing coronavirus resources.
You can also find the slides from Rik and Kristen’s talks.
Analyzing ArXiv data using Neo4j: Part 1
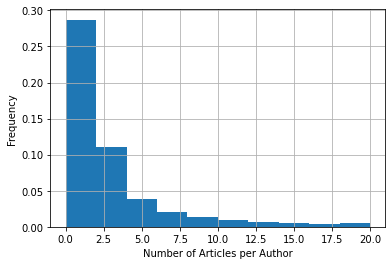
ArXiv is a website that provides access to over 1.7 millions scientific papers in the fields of mathematics, physics, computer science, and more. It’s maintained by Cornell University, who last week released the articles as a Kaggle dataset.
Estelle Scifo, the author of Hands on Graph Analytics, has started a series of blog posts exploring the data. In part 1 she gets the data into Neo4j using the Import Tool and writes some exploratory queries.
This looks like a super fun dataset, I’m already looking forward to part two.
Kickstart your transition from SQL analytic and window functions to Neo4j

SQL supports window functions, which enable users to run calculations for each row in a table while having the calculation include values from other rows within an offset around the current row.
In Nathan Smith’s latest blog post, he shows how to achieve the same functionality in Cypher with a bit of help from APOC, Neo4j’s standard library.
Data Import using RxJS, Link Prediction Guide, Interview with ICIJ’s Emilia Struck

- In Adam Cowley’s latest blog post, he demonstrates how to import data from a bunch of files into Neo4j using RxJS, a reactive programming language for JavaScript and TypeScript.
- Lju wrote a summary blog post about the Summer of Nodes, an event that she hosted with Alex Erdl during August 2020.
- We added a new Graph Data Science developer guide showing how to solve a link prediction problem using the GDS Library and scikit-learn, a popular Python machine learning library.
- Last week Chris Skardon announced the launch of version 4.0 of Neo4jClient, a .NET client for Neo4j. This week Chris has written a detailed write-up , explaining all the new and shiny things in the release.
- Datanami has an interview about the FinCEN files with Emilia Struck, the ICIJ research editor who oversaw the data and research teams. Emilia explains how they cleaned the data, and then used Neo4j and Linkurious to make sense of the data.
One graph to rule them all

Felisia Loukou and Dr Matthew Gregory work at GOV.UK in the Data Labs team, which was formed to improve data science capabilities with government data. One of the projects they’ve been working on is govGraph, a Neo4j Knowledge Graph that contains user journey data, website content, and more.
In the blog post, they explain how they’re able to make sense of the data with Cypher queries and the Graph Algorithms (now GDS) library. They also describe a prototype that they built using neovis.js to understand the ways that users navigate website content.
Tweet of the Week
My favourite tweet this week was by Alexander Jarasch:
It is remarkable that we have never met in person but somehow we know each other and perfectly work together – in other words: GRAPHS LITERALLY CONNECT.@CovidGraph @yworks @structr @PRODYNASE @neo4j @Neo4jDE @derivo @Helomics_ @scubedglobal @DiabResearch @JirosMunro pic.twitter.com/8JxFQkg3Dl
— Alexander Jarasch (@AJarasch) September 28, 2020
Don’t forget to RT if you liked it too!
Share Article


Explore
Related Articles

This Week in Neo4j: GraphRAG, GraphAcademy, Knowledge Graphs, Symfony and more

This Week in Neo4j: Certification, Developer Tools, GraphRAG, Knowledge Graphs and more

This Week in Neo4j: Certification, Graph Analytics, Agentic AI, Knowledge Graph and more


