
This Week in Neo4j – ETL Tool UI Revamp, Gaming the Christmas Market, Intelligence led Policing

Developer Relations Engineer
3 min read

Welcome to the 4th edition of This Week in Neo4j for 2019.
January is practically over and the Neo4j community has been busy. The Neo4j ETL Tool UI has had a complete revamp and we have a late entry for the best Christmas blog post of 2018. Joe Depeau presented another great webinar, this time on Intelligence led policing and Estefania Cassingena Navone has written an excellent visual introduction to graphs.
Featured Community Member: Lju Lazarezic
This week’s featured community member is Lju Lazarezic, Senior Presales Consultant at Neo4j.
Lju Lazarezic – This Week’s Featured Community Member
Lju has been part of the Neo4j community for just over 18 months, and works in our London office. Lju has presented on a variety of topics in that time, including
What is a Graph Database? at the Connected Data London Conference, a webinar on maintaining your Data Lineage in a Graph, and Bloom tips and tricks for domain knowledge experts at GraphConnect NYC 2018.
Lju blogs regularly about Neo4j, and this week wrote a couple more blog posts – one showing how to use the new Neo4j Kafka Streams connector to build an event-driven graph analytics pipeline, and the other a food graph based on the BBC goodfood dataset.
On behalf of the Neo4j community, thanks for all your work Lju!
Intelligence led Policing with Neo4j
This week Joe Depeau presented a webinar showing how to use Neo4j for Intelligence led Policing.
Joe gives an overview of how graph data analysis can be used to enhance traditional investigative methods, explains the POLE data model that allows this analysis, and then gives a live demo of the Crime Investigation Sandbox that he launched in December.
Neo4j ETL Tool 1.3.1 Release: White Winter
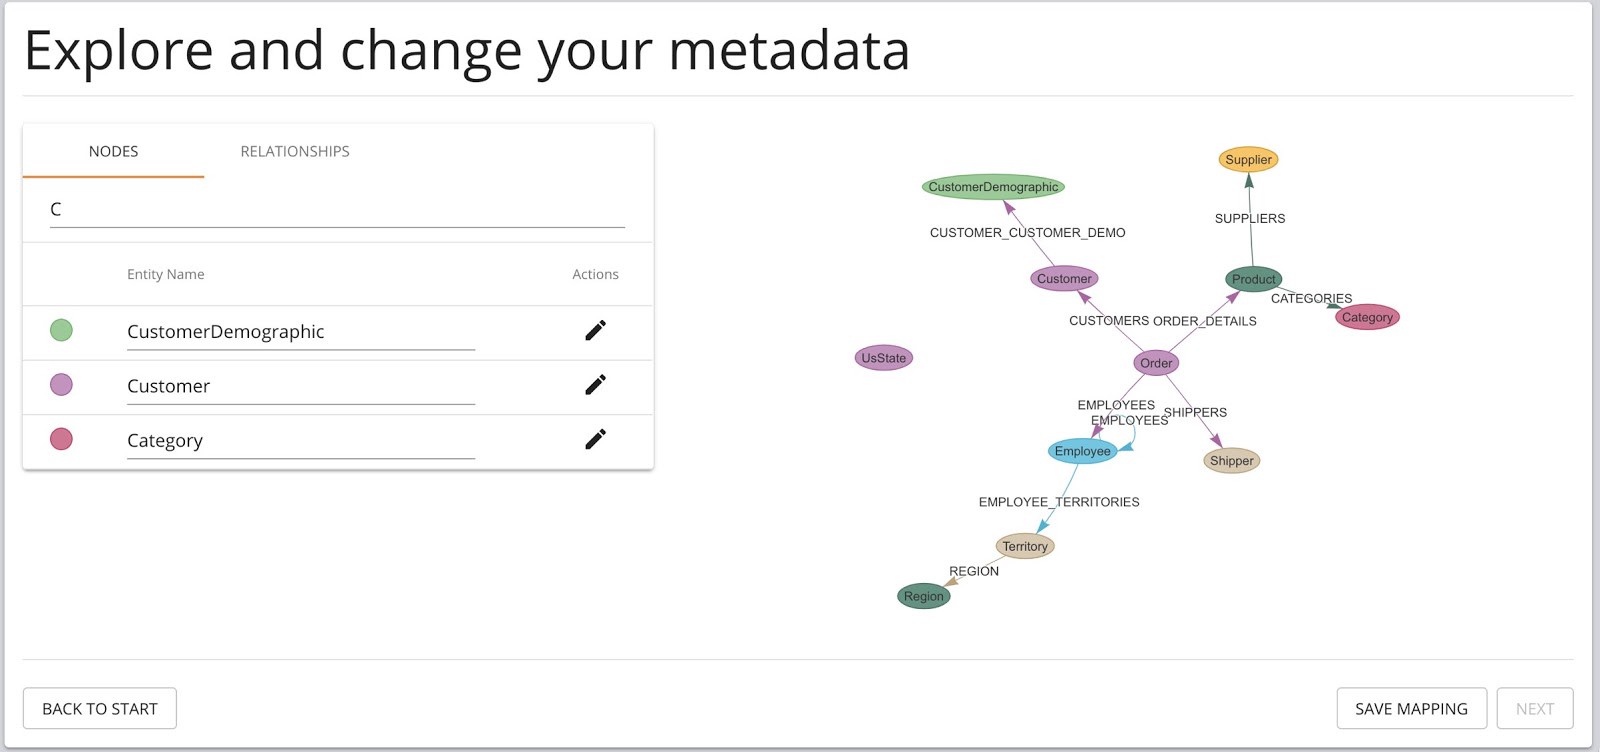
Early this week Michael announced the release of version 1.3.1 of the Neo4j ETL Tool, and from this version onwards, you will no longer need an activation key to use the Neo4j ETL Tool in Neo4j Desktop.
The UI has also had a complete revamp based on user feedback, and there are bug fixes to handle composite keys in MSSQL, CSV quoting, and the new auth approach in MySQL 8.0.4+.
Graphs: A Visual Introduction for Beginners
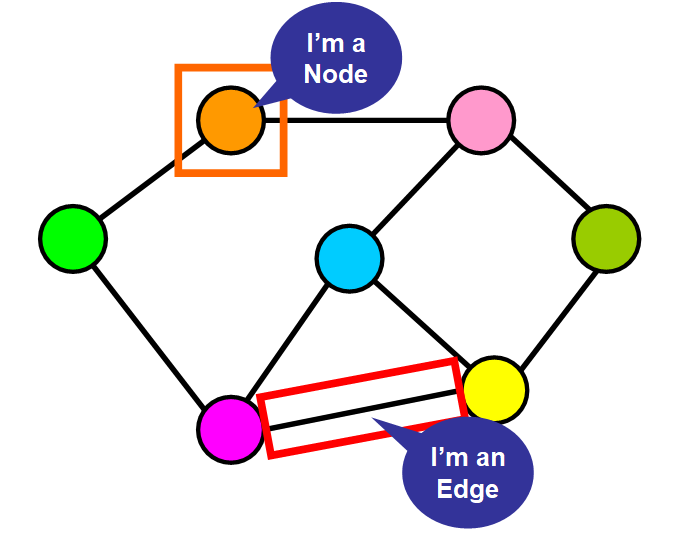
Estefania Cassingena Navone has written a fantastic diagram driven introduction to graphs.
If you’re curious about the difference between directed and undirected graphs, weighted and unweighted graphs, dense and sparse graphs, and more, this is the post for you.
Gaming the Christmas Market
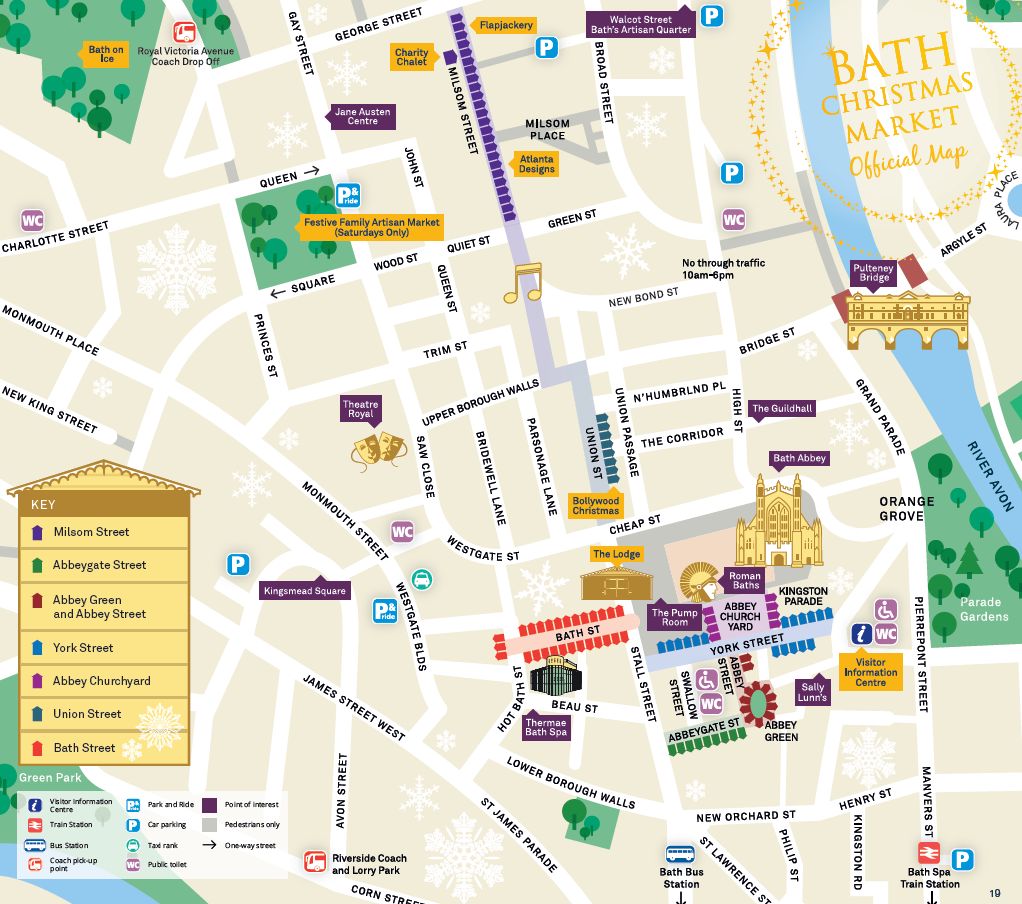
Christmas may have been a month ago now, but David Barton is still in the Christmas spirit, and has written a blog post graphing the Bath Christmas Market.
David uses Neo4j to determine the optimum route through the Christmas Market, given a set of mandatory chalets to purchase from. (a.k.a. The Travelling Salesman Problem). He also shows how to create a user friendly visualisation of the route using Neo4j Desktop, making use of APOC’s virtual nodes and relationships.
Create a Data Marvel: Connecting the Graph

In the 7th post in Jennifer Reif‘s series of posts showing how to build a full stack application with Spring and Neo4j, Jennifer shows how to write the code to pull back the relationships that connect the entities introduced in the last two weeks.
In a detailed walk through, Jennifer explains where Spring Data Neo4j can infer what data to pull back based on the name of a function, and where a custom query needs to be specified.
Tweet of the Week
My favourite tweet this week was by Tom Michiels:
The vectr training catalogue is launched today. This is me doing my graphy thing. #neo4j #vectr https://t.co/ARTuYRvUUr. We can also talk reactive! #reactive #akka pic.twitter.com/UQERL8MlzY
— Tom Michiels (@_TomMichiels_) January 24, 2019
Don’t forget to RT if you liked it too.
That’s all for this week. Have a great weekend!
Cheers, Mark
Share Article


Explore
Related Articles

This Week in Neo4j: GraphRAG, GraphAcademy, Knowledge Graphs, Symfony and more

This Week in Neo4j: Certification, Developer Tools, GraphRAG, Knowledge Graphs and more

This Week in Neo4j: Certification, Graph Analytics, Agentic AI, Knowledge Graph and more


