
This Week in Neo4j – GraphQL Library V2, AuraDB Free Demo, Power BI, MLOps, the Louvre, and Discourse Versus Discord

Data Science Advocate
5 min read
Hello, everyone!
Here we are already in mid-August and the summer is quickly winding down. But the community is still hard at work and doing some great things with graphs!
There was some big news within the Neo4j community this week about the release of the GraphQL library v2.0.0. There is plenty to discuss over the next few weeks, but in this edition of Twin4j you will find lots of preliminary information about this release.
In addition to that, we have a lot of other exciting stuff to talk about – things like getting up and running on AuraDB Free with a fun graph of a chess match. There are also some great posts below about graph data science and MLOps. And we wrap up with a look at the different ways you can interface with the Neo4j community on Discourse versus Discord.
Featured Community Members: Daniel Starns and Darrell Warde
This week’s featured community members are Daniel Starns and Darrell Warde.
Daniel Starns and Darrell Warde – This Week’s Featured Community Member
Dan Starns and Darrell Warde are both software engineers on the GraphQL team at Neo4j in London. If you’ve used GraphQL with Neo4j at all, chances are you’ve come across their work. Dan and Darrell have been working together to build the Neo4j GraphQL Library, which had a major 2.0 release this week.
In addition to engineering work, Dan and Darrell support the Neo4j community by being extremely active and helpful on the Neo4j Discord server (especially the #graphql channel!), writing blog posts, and giving talks. For example, at NODES 2021 Dan presented “Securing Your Graph With Neo4j GraphQL,” and Darrell presented “Neo4j and GraphQL: The Past, The Present and The Future.” Thanks so much Dan and Darrell for all you do to support the Neo4j community!
Release of the Neo4j GraphQL Library 2.0.0
The Neo4j GraphQL library version 2 is now available! In addition to incorporating several learnings from v1, there are many new features associated with this version. One of the most exciting new additions is the inclusion of relationship properties in a low-friction way with familiar constructs. Other additions in this version include cursor pagination, count queries, improvements with union relationship fields, and many more. If this all sounds good to you, follow this migration guide to quickly get you moved from v1 to v2.
Lju and Alex Demo AuraDB Free with the World Championship Chess Match
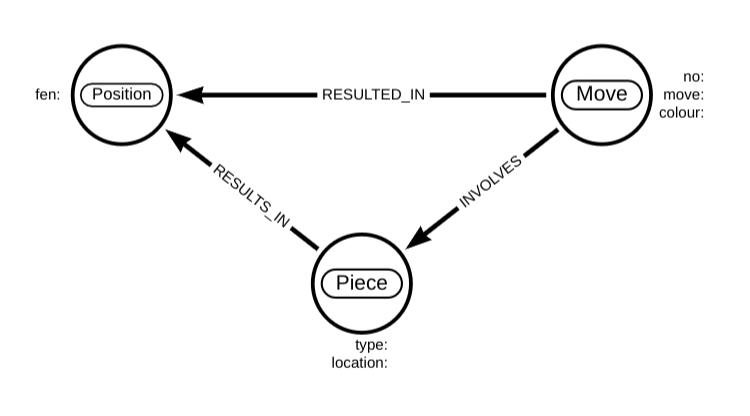
As part of their ongoing Twitch series, Lju Lazarevic and Alex Erdl continue their demonstrations of AuraDB Free. In this week’s Twitch stream, they looked at the moves of the championship chess match of Carlsen versus Caruana (2018) scraped from Board Game Geek. The data model is discussed in detail as well as explorations of the use of chess board positions, commonly used pieces, and what moves those pieces played.
If you have any graphs you want to see highlighted in future Twitch streams, please let them know!
Visualize Stock Volume Similarity with Neo4j and Power BI

In his next post in a series on Power BI and Neo4j, Bryant Avey wrote up a post from his Bootcamp session on how to create Power Query templates to import data from Neo4j. He then uses algorithms from the Neo4j Graph Data Science library to score and categorize volume similarity between stocks. He also uses Power BI to visualize the data in a variety of ways.
NODES 2021 Talk: Set Your Graph in Hyperdrive with Machine Learning and MLOps
At NODES 2021, Camilla Dal Rio, a data scientist at Moviri Analytics, presented a talk about building MLOps native apps with Neo4j. The goal of her work is to create a platfrom that addresses the problem of mapping IT systems from a variety of points-of-view, including things like anomaly detection and scenario simulation for configuration change. The platfrom she presented ingests a variety of different data sets, both in batch and in streaming modes. She discussed the use of a several algorithms in the Graph Data Science library that she uses to solve problems like the prediction and analysis of incident propagation and identification of potential hot areas in the network for that propogation.
Examining the Louvre

In part 3 of her series exploring the Louvre as a graph, Priya Jacob uses the Graph Data Science library to analyze the collection of art. In particular, she demonstrates how to use algorithms like node similarity and the Louvain method for community detection to make inferences on the artwork. For example, her results demonstrate the node similarity of Michelangelo to a variety of other associated with the Renaissance period – all with the power of a graph! She also looks at the detected communities of German and Dutch artists within the graph belonging to the German Renaissance/Baroque periods. In other exciting results, she is able to identify similar paintings with great visible accuracy.
Discourse vs Discord
If you are like many of us, you have found yourself asking when to reach out to the Neo4j via Discourse, the home of the community discussion pages, versus Discord, the live chat environment. Andreas Kollegger, one of the members of the Neo4j Developer Relations team, has written up a guide with some good “rules of thumb” on how to know which to use when.
Tweet of the Week
My favorite tweet this week was by Michael Dausmann:
That feeling when you find a free tool which is actually awesome! Currently doing some hardcore #graph #modelling with the arrows app from the guys at @neo4j check it out https://t.co/k2crqdrXLi pic.twitter.com/NZkaSCR0su
— Michael Dausmann (@JavascriptMick) August 9, 2021
Don’t forget to RT if you liked it too!
Share Article


Explore
Related Articles

This Week in Neo4j: Certification, Developer Tools, GraphRAG, Knowledge Graphs and more

This Week in Neo4j: Certification, Graph Analytics, Agentic AI, Knowledge Graph and more


