
This Week in Neo4j – IT Operations and graphs, Building An Election Night Dashboard, Central Park Sandbox

Developer Relations Engineer
3 min read


Hi graphistas,
Welcome to the last version of TWIN4j for 2020. We’ll be taking a couple of weeks off over Christmas and the New Year, so we’ll see you again in 2021!
Until then we need your help! Our Developer Survey 2020 is waiting for your answers. Please support us by filling it out. For a few minutes of your time you can help us make better decisions for the future and earn $10 or donate $10 to a charity.
Our video this week features a couple of talks from the NODES 2020 Extended series.
Luanne Misquitta shows how to analyse IT Operations data using Hume, Will Lyon builds an Election Dashboard, and Lju Lazarevic launches the New York Central Park sandbox.
And finally, Will Lyon has started building a podcast application with the GRANDstack.
Cheers,
Mark and the Developer Relations team
Featured Community Member: Klaus Blass
This week’s featured community member is Klaus Blass.
Klaus Blass – This Week’s Featured Community Member
Klaus is a Consultant at the Development Data Group at the World Bank, assisting National Statistical Offices worldwide to conduct surveys and censuses.
He has been working in the IT industry for more than 40 years. During that time, he’s worked as an IBM Systems Engineer, supervisor of the Computer Centre for the Engineering Division at Kuwait Oil Company, and run his own company creating satellite communication solutions for telemetry applications
Recently, he’s been doing a lot of work with CAPI surveys and censuses and converted the census data for a Health and Demographic Surveillance System (HDSS) in Burkina Faso to a Neo4j graph. Klaus presented his work in the A Survey As A Graph talk at the NODES 2020 conference.
And this week Klaus also published a blog post based on his talk.
NODES 2020 Extended with Monojit Basu, Reuben Teijeiro and Aleksandra Asanin
Our video this week is from the NODES 2020 Extended series of talks.
There are two talks in this session. In the first talk, Monojit Basu discusses manifold structures in semi-supervised and multiview learning. In the second one, Aleksandra Asanin and Reuben Teijeiro explain how Neo4j helps in the recruiting process.
IT Operations and graphs, brought together by Hume insights

Luanne Misquitta has written a blog post, in which she shows how to model IT Operations as a knowledge graph in Hume.
She also demonstrates how to derive actionable insights, including single points of failure and dependency analysis.
Building An Election Night Dashboard With Neo4j Graph Apps: Bloom, Charts, And Neomap
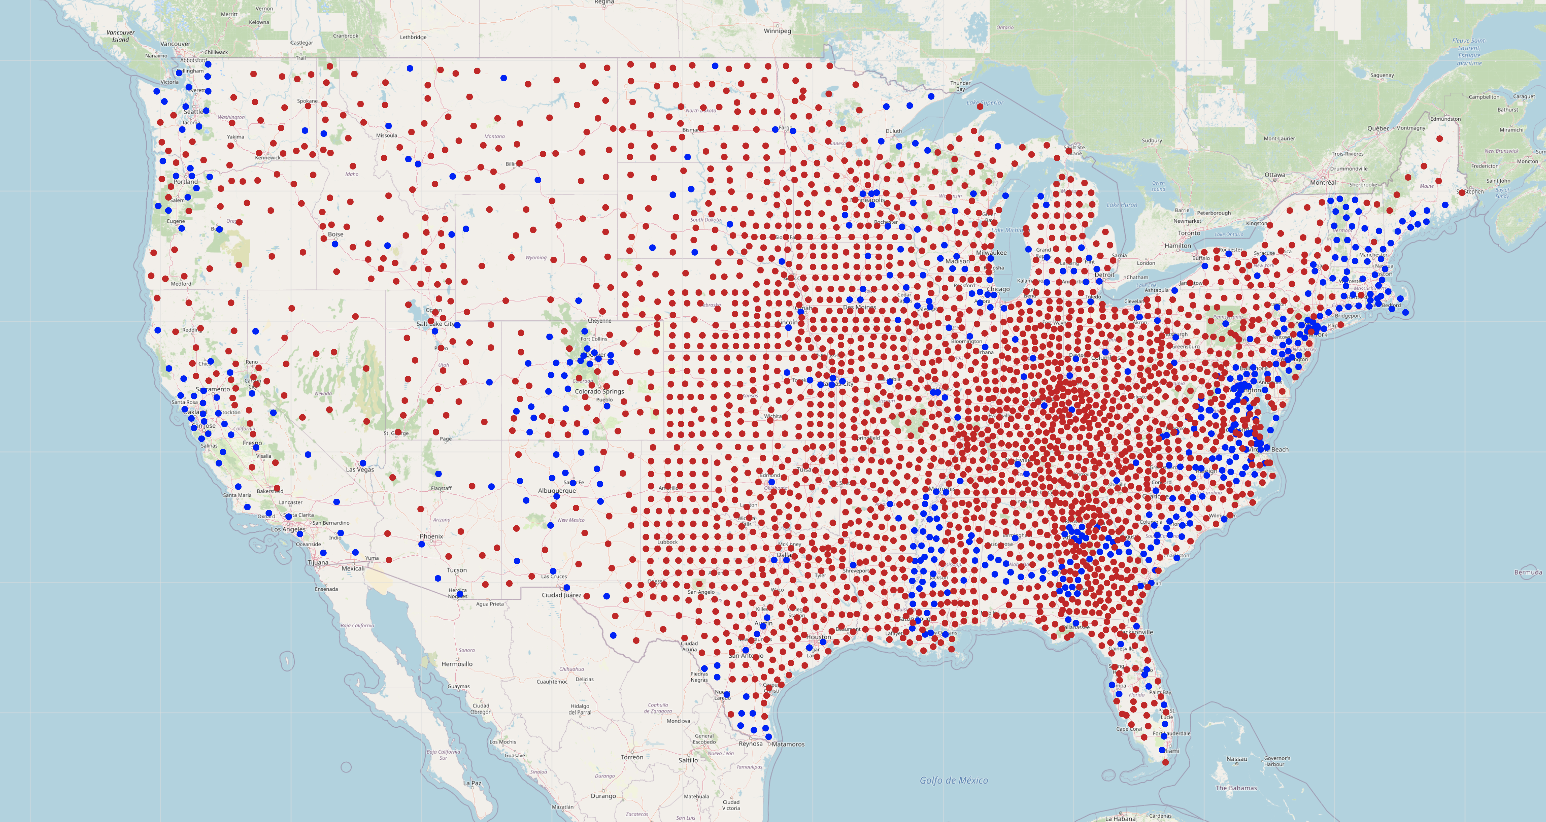
In Will Lyon’s latest blog post, he shows how to use low code graph apps to build data visualizations around the US election with Neo4j.
The first part of the post is all about data import, before Will covers the rule based styling feature in Neo4j Bloom, as well as the recently added hierarchical layout. After that he builds some charts using Adam Cowley’s Charts Graph App, before conclusion with some spatial visualisations using Neomap.
Central Park Sandbox, JMeter Bolt Sampler, Neo4j on Windows Server 2019 Core Server

- Lju Lazarevic launched the New York Central Park sandbox.
- Chris Skardon explains how to run Neo4j on a Windows Server 2019 Core Server.
- Michael Simons has created a repository in which he shares examples of how to connect to Neo4j on the JVM, reading and writing data.
- Mark Lilley wrote a blog post showing how to use the Bolt sampler that was added in Apache JMeter 5.2 This sample lets users run Cypher queries through the Bolt protocol and is a good way to test Neo4j procedures.
- David Stevens announced the release of full text analytics support into Digital Explorer
Podcast Search GraphQL API With Neo4j And The Podcast Index

This week on Will Lyon’s live stream he kicked off a new project: building a podcast application with the GRANDstack.
In this first blog post, Will designs the graph model and implements the podcast search using data from the Podcast Index API.
Tweet of the Week
My favourite tweet this week was by Estelle Scifo:
One week ago, I had never heard of abstract syntax trees. Now, I see them everywhere! (python -> Cypher, GraphQL -> Cypher, …)
— Estelle Scifo (@st3llasia) December 1, 2020
Don’t forget to RT if you liked it too!
Share Article


Explore
Related Articles

This Week in Neo4j: Certification, Developer Tools, GraphRAG, Knowledge Graphs and more

This Week in Neo4j: Certification, Graph Analytics, Agentic AI, Knowledge Graph and more


