This Week in Neo4j – Neo4j BI Connector, COVID-19, Supply Chain Management

Developer Relations Engineer
4 min read

Hi graph gang,
I’m back to take over the TWIN4j reins. Thanks to Jennifer, Will, and Lju for curating the weekly graph news in my absence.
In this week’s video, Calin Constantinov shows us how to make graph patterns show themselves in various datasets.
We had the launch of the Neo4j BI Connector, TasoX explores Windows Events, and Rik begins his journey into the world of supply chain management.
And finally, several COVID-19 related projects have been created. Be sure to check those out, and if you have free time, I’m sure they’d appreciate any help you can give.
Featured Community Member: Siraj Munir
This week’s featured community member is Siraj Munir, Lecturer of Computer Science at PAF-Karachi Institute of Economics & Technology, and Data Scientist.

Siraj Munir – This Week’s Featured Community Member
Siraj has been an advocate for graphs for quite a while now and has got involved in our community in almost every opportunity he’s had. He’s organized events in Karachi, Pakistan as part of Global Graph Celebration Day events (in 2019 for the 1st ever GGCD and again this year), he’s part of our Neo4j Speaker Program.
He also submitted an awesome project for Graphs4Good GraphHack – Knowledge Graph to the Rescue. We just did our kick-off this past Friday and projects have been posted.
It’s pretty apparent that Siraj feeds off the combination of learning and teaching, helping and sharing. He even launched Nerd’s Lab late last year, with a goal to “share knowledge and skills” and “link academia knowledge with industry ecosystem”.
Siraj, we’re so thankful to have you in our community! Thank you for being so passionate about helping others be better. You’re a true contributor and we admire your hard work!
NODES 2019: Making patterns show themselves
In this week’s video from the NODES 2019 online conference, Calin Constantinov shows us how to make graph patterns show themselves.
In the talk Calin takes us through various datasets, including LinkedIn and the Facebook graph, and shows the insights that can be derived from each one.
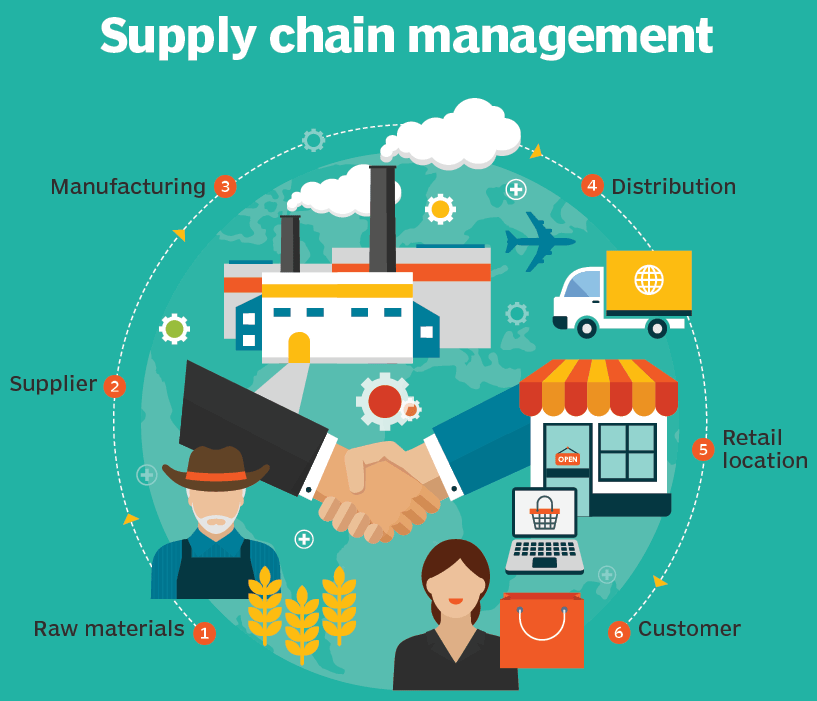
Supply Chain Management with graphs: Part 1 – Data wrangling and import

Rik Van Bruggen has started writing a series of blog posts about supply chain management with graphs.
In part 1 Rik explains his search for an appropriate dataset and then takes us through the steps to import and clean up the data.
Windows Events & Sysmon Visualization using Neo4j (part 1)

TasoX has started writing a series of blog posts showing how to gain an in-depth understanding of Windows Events using graphs.
In part 1 TasoX explains how to enable Windows Events Forwarding and describes the challenges he overcame while using the Neo4j Python driver to import XML data produced by Windows Event Viewer.
COVID-19 Round-up

The Neo4j community has been busy making sense of the COVID-19 pandemic data using graphs. Below are some of the projects that I came across this week:
- tracemission is a project submission from the WirvsVirusHackathon. It lets users log their presence during specific time slots at a location. If a virus infected person visited the location at the same time, Tracemission supplies means to contact individuals potentially at risk of an infection.
- The Upcode Academy have created a graph-based data visualization of cases in Singapore, using Neo4j.
- Alex Law has been compiling cases caused by cross-country travel from the available reports to create a travel log for COVID-19. Alex then uses Neo4j and GraphXR to detect the hubs that have spread the virus and to find out how the virus first reached different locations.
- CovidGraph is a project working on the integration of publications and molecular data on COVID-19 in a Neo4j graph.
Getting Started with the Neo4j BI Connector

This week David Allen and Logan Smith announced the release of the Neo4j BI Connector, a tool that delivers direct access to Neo4j graph data from business intelligence (BI) tools.
The BI Connector lets users write SQL queries from BI tools like Tableau, Looker, TIBCO Spotfire Server, and Microstrategy. These queries are translated to Cypher queries, executed against a Neo4j database, and then return results in tabular form.
If you have any questions or feedback, please send David and Logan an email at ecosystem@neo4j.com.
Tweet of the Week
My favourite tweet this week was by Lynn Chiu, who’s been using Neo4j to track Coronavirus cases in Taiwan:
1/ Though the cases quadrupled in the past week to 215, Taiwan has so far been able to track the details and contacts of every single confirmed case. Using data from the Taiwan CDC, I’m using #neo4j to build a source & transmission graph database & network visualization. #dataviz pic.twitter.com/OTS6ViNOV7
— Lynn Chiu (@drlynnchiu) March 24, 2020
Don’t forget to RT if you liked it too!


