This Week in Neo4j – Pink Programming, Graph Visualization using Neovis.js, Analysing Debian Packages

Developer Relations Engineer
3 min read

Welcome to this week in Neo4j where we round up what’s been happening in the world of graph databases in the last 7 days.
This week we have Graph Visualization using Neovis.js, a write up of the Pink Programming event, analysing Debian packages, and more.
Featured Community Member: Norbert Preining
This week’s featured community member is Norbert Preining, Research and Development Engineer at Accelia Inc.

Norbert Preining – This Week’s Featured Community Member
Norbert has been using Neo4j to analyse the Ultimate Debian Database. In October 2017 he presented at our online meetup and showed how to write Cypher queries to explore dependencies between packages.
More recently Norbert has started a blog series where he goes into more detail:
You can also find Norbert’s code in the debian-graph GitHub repository.
On behalf of the Neo4j community, thanks for all your work Norbert!
Neo4j <3 Pink Programming
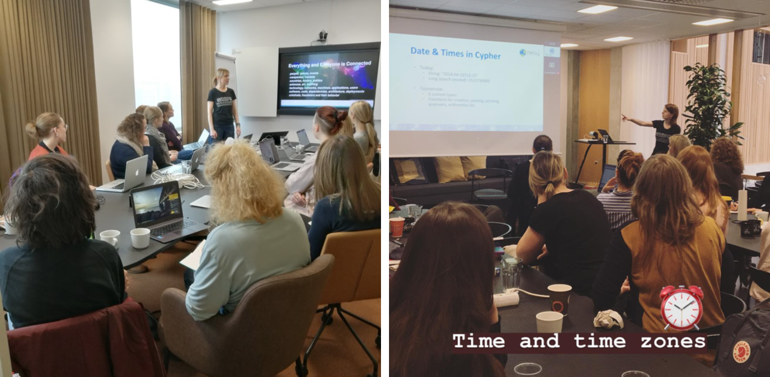
Last weekend my colleagues Louise Söderström and Maria Scharin hosted a Neo4j fundamentals workshop for the Pink Programming group.

In the morning participants learned the basics of our query language Cypher and did some hands-on Cypher tutorials based on the Movies example database.
After lunch they got a sneak peek at the new date data type that will be introduced in Neo4j 3.4 and Louise explained all the weird corner cases when implementing support for dates, times and time zones.
On the podcast: Irene Iriarte Carretero
This week on the podcast Rik interviewed Irene Iriarte Carretero, Data Scientist at Gousto and our featured community member from 3rd March 2018.
Rik and Irene discuss the recipe-similarity problem and Irene explains all the different dimensions that go into building a hybrid recommendation model that combines collaborative and content based filtering.
Screencast: Graph Visualization With Neo4j Using Neovis.js
My colleague Will Lyon has created a screencast in which he shows how to use neovis.js, a visualization tool he built that combines Neo4j with the vis.js JavaScript library.
Will demonstrates how to find influential nodes and communities of users in the Russian Twitter Troll dataset by combining Graph Algorithms and Graph Visualization.
GORM with Neo4j, Visualizing GoT
- Jorge Aguilera has written a post showing how to use GORM, Groovy-based data access toolkit, with Neo4j. In the article Jorge describes how to write a Groovy based command line application to query the Panama Papers dataset.
- In Neo4j Graph Visualizations using GoT dataset Tomaz Bratanic shows how to combine Neo4j graph algorithms with various visualizations, including SpoonJS, 3d-force-graph, and neovis.js , to try and understand what’s happening in Westeros.
Next Week
What’s happening next two weeks in the world of graph databases?
| Date | Title | Group | Speaker |
|---|---|---|---|
|
April 25th 2018 |
The Fragment Network: A Chemistry Recommendation Engine Built Using Neo4j |
Richard Hall |
|
|
April 25th 2018 |
|||
|
April 25th 2018 |
Tweet of the Week
My favourite tweet this week was by Ian Hunter
Top programming languages to learn in 2018 (by popularity). TS is top of my list too, but I’d also like to add Neo4J/Cypher, really cool technology/datastore: https://t.co/HvTjashuvq
— Ian Hunter (@ianhunter) April 16, 2018
Don’t forget to RT if you liked it too.
That’s all for this week. Have a great weekend!
Cheers, Mark


