
This Week in Neo4j – Release of Neo4j ETL Tool, UK Corporate Interests Graph, Documents as Graphs

Developer Relations Engineer
4 min read

Welcome to this week in Neo4j where we round up what’s been happening in the world of graph databases in the last 7 days.
This week we have a new release of the Neo4j ETL Tool as well as a couple of new articles in our Graph Visualization series. A video of Adam Hill’s PyData London 2018 talk about building a UK corporate interests graph is online, Max De Marzi shows how to store documents as graphs, and more.
Featured Community Member: Dilyan Damyanov
This week’s featured community member is Dilyan Damyanov, Data Analyst at Snowplow Analytics.
Dilyan Damyanov – This Week’s Featured Community Member
Dilyan has been part of the Neo4j community for a couple of years and has been using Neo4j to make sense of event data, which he’s written about in a couple of blog posts.
Dilyan presented his work at the London Neo4j Meetup and Neo4j Online Meetup and also featured on the Graphistania podcast in March 2018.
On behalf of the Neo4j community, thanks for all your work Dilyan!
Searching for Shady Patterns: Shining a light on UK corporate ownership
A few weeks ago I attended the PyData London 2018 conference and one of my favourite talks was by Adam Hill.
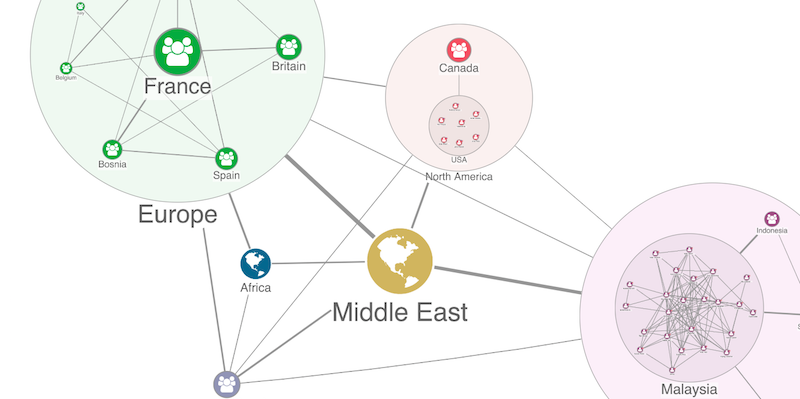
Adam gave an experience report of a DataKind UK and Global Witness project where they built the world’s first network graph mapping all of the UK public data on those who control corporate interests in the country
It comprises in excess of 4.5 million companies and 4 million individual people as well as
company officer data and metrics of financial secrecy based upon geographic regions.
Adam explained how Neo4j and the Cypher query language could be used to search for ‘shady patterns’ which could act as leads for investigative journalists to expose corrupt practices.
a16z Podcast: When Journalism Goes Global

I came across an interesting interview on the a16z Podcast with ICIJ director Gerard Ryle in which he explains the role the ICIJ has played in bringing together news organisations from all over the world in the publication of OffShore Leaks, Panama Papers, Paradise Papers, and West Africa Leaks.
In the middle of the interview Gerard goes through the different tools the ICIJ uses to help investigative journalists make sense of data, including Neo4j and graph visualization tool Linkurious.
You can listen to their conversation below or on the a16z website.
Spring Data Neo4j at Spring IO, Storing documents in graphs, Graph Gopher Release
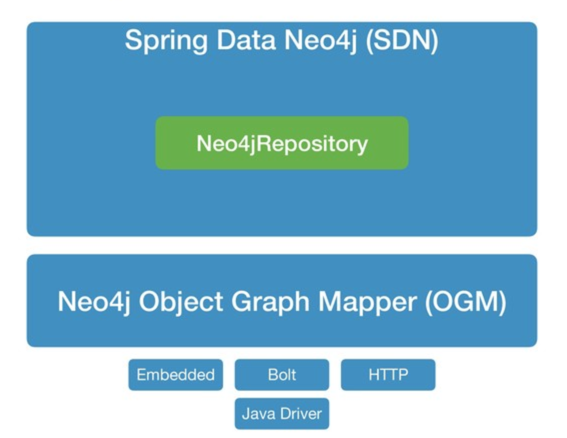
- Gerrit Meier shared the slides from his talk at Spring IO in which he explains how to build Spring backed applications using Spring Data Neo4j.
- In Max De Marzi‘s latest blog post he shows how to take a document, such as a text file or PDF, use Apache Tika to detect and extract metadata and text, and finally then run that text through a set of NLP models from OpenNLP to find interesting Entities which are then stored in Neo4j. All the code is available in the maxdemarzi/que_dicen GitHub repository.
- Graph Gopher, the Neo4j browser for your iPhone or iPad released version 1.0.3. This release includes bug fixes and the latest updates to Theo, the Neo4j Swift Driver.
- Cristina Escalante created FL-Division-of-Elections-scanners, a set of scripts that can be used to import campaign finance data from Florida’s Division of Elections website.
New Release of Neo4j ETL Tool
On Thursday we released version 1.2.0 of the Neo4j ETL Tool, a tool that makes it easy to convert your relational data into a Neo4j graph.
This version contains multi schema support, additional driver support for Microsoft SQL Server, IBM DB2 and Oracle RDBMS, as well as general improvements around the loading process.
You can watch the above video to learn how to use the Neo4j ETL application on Neo4j Desktop to import your relational data into Neo4j
Graph Visualization Series: yWorks and Keylines
This week we have two new entries in our series of posts on Graph Visualization tools.
Sebastian Müller has written a blog post in which he shows how to use yWorks and Neo4j to create high-quality graph and diagram visualizations for end-user applications.
You can download a free evaluation version of the yFiles for HTML software package if you want to try out the tool.
Dan Williams has also written a post in which he explains how to run a demo using Neo4j and Keylines. The examples uses Cypher queries and KeyLines’ incremental layout to explore a Neo4j dataset of movies and actors.
You can get a trial license for Keylines if you want to reproduce Dan’s post.
Tweet of the Week
My favourite tweet this week was by Dinis Cruz:
This is pretty awesome (see pic)
That is a @visjs rendering of @Jira GDPR Data Journeys data that has been imported to @neo4j
Created by the PhotoBox Group Security team 🙂
If you want to see it in action , join us at the @opensecsummit pic.twitter.com/5CJ3Hg894l
— Dinis Cruz (@DinisCruz) May 30, 2018
Don’t forget to RT if you liked it too.
That’s all for this week. Have a great weekend!
Cheers, Mark
Share Article


Explore
Related Articles

This Week in Neo4j: Certification, Developer Tools, GraphRAG, Knowledge Graphs and more

This Week in Neo4j: Certification, Graph Analytics, Agentic AI, Knowledge Graph and more


