Welcome to this week in Neo4j where we round up what’s been happening in the world of graph databases in the last 7 days.
Featured Community Member: Lorenzo Speranzoni
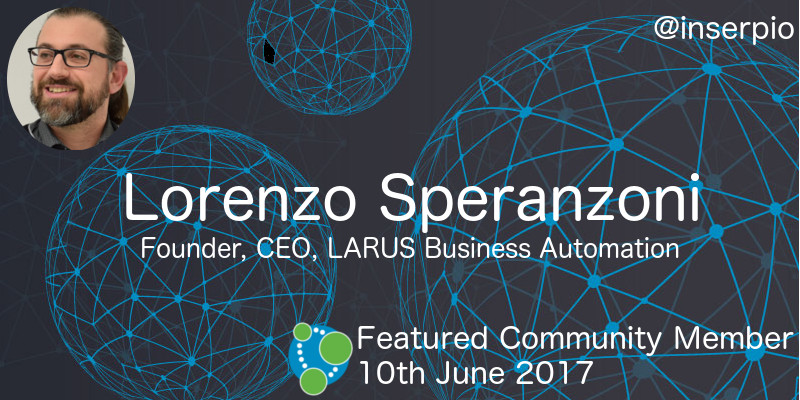
This week’s featured community member is Lorenzo Speranzoni – Founder & CEO of LARUS Business Automation, Neo4j’s premiere Italian partner especially for data integration.

Lorenzo Speranzoni – This week’s featured community member
Lorenzo has been part of the Neo4j community since 2013. He started with mapping out Vincent van Gogh’s journey using Spring Data Neo4j and Neo4j-Spatial which led to the Neo4Art initiative. Lorenzo prefers graph databases over other NoSQL databases because of the flexible and expressive connected data model.
To make it easier to integrate other databases with Neo4j he and his team worked on connectors for RDBMS, Couchbase, and MongoDB. They also developed and are maintaining Neo4j’s JDBC driver which allows you to use existing ETL and BI Tools with our graph database. In the recent months the Larus team has been supporting APOC development and improving the neo4j-etl-components.
Lorenzo’s spoken multiple times at GraphConnect conferences and he and his team at LARUS are very active members in the community.
My team finished up our engagement with @AgileLARUS today. I cannot say enough good things. If you want @neo4j guidance I highly recommend.
— Don Abney (@DonAbney) June 2, 2017
Thank you Lorenzo and team for all your work on behalf of the Neo4j community!
Visualizing crime patterns data as a graph
Christian Miles wrote an article showing how to combine Neo4j and Keylines to visualize crime patterns data as a graph.
In the post Christian imports data from the data.boston.gov initiative into Neo4j using APOC’s Load JSON procedure, before analysing it by district and crime category.
He goes on to add generated people, phone, and vehicle data to the graph to simulate the type of investigation a police officer might undertake.
Game of Thrones, Fighting Financial Crime, H2O
- Swapnil Kumar has built a Game of Thrones graph in preparation for Season 7 which should be released in the next month or so.
- The NfqAdvisory team wrote up their experience of a Graph Databases applied to Fraud Detection event in Spain.
- Intercax released version 3.1 of Syndeia – a software platform for integrated model-based engineering – which now allows users to generate graphs from SysML models or/and its interconnections to model elements in other enterprise repositories. Users can then execute Cypher queries on these graphs to make sense of the data.
- Giovanni T. Parra put the code for boardthreads.com – a service that used Mailgun and Neo4j to turn a Trello board/list into a helpdesk – on GitHub after deciding to shut it down.
- Elise Devaux, Marketing Project Manager at Linkurious, explains how graphs can be used to fight financial crimes and money laundering. Elise shows how you can setup a fraud watch-list to keep you informed when money laundering patterns occur and then use Linkurious’ graph visualization interface to investigate and assess the different cases.
- Michael Moore created neo4j-h2o-template, which contains a set of iPython notebooks that show how to combine Neo4j with H2O.ai – the open source machine learning platform.
From The Knowledge Base
This week from the Neo4j Knowledge Base we have a couple of workarounds for the lack of post UNION processing in Cypher.
openCypher: Transactions and Analytics with Neo4j and Cypher for Spark
We’re releasing roughly one video a day from GraphConnect Europe 2017, and this week saw the release of the openCypher talk given by Alastair Green, Stefan Plantikow, and Petra Selmer.
In the talk they cover using Cypher for OLTP workloads on Neo4j and OLAP workloads on Spark. They also propose a syntax for multi graph queries and the ability to return graphs from Cypher.
Next Week
What’s happening next week in the world of graph databases?
- On Tuesday June 13th, 2017 Rik Van Bruggen will be showing how to explore corporate networks in Neo4j at the Neo4j Belgium meetup.
- On Wednesday June 14th, 2017 Christophe Willemsen will show how to create a Chatbot with Amazon Alexa and Neo4j based NLP at the Graph Database – Czech Republic meetup in Prague.
- On Thursday June 15th, 2017 Pat Patterson will be joining the Neo4j Online Meetup to talk about visualizing and analyzing Salesforce data with Neo4j.
- Also on Thursday June 15th, 2017 Preston Hendrickson will show how to implement some of the new enterprise security features at the Graph Database Baltimore meetup.
Tweet of the Week
My favourite tweet this week was by the Sinar Project – an initiative using open source technology, development and ideas to make Malaysian government transparent and accountable.
Unmasking complex systematic corruption requires innovative approaches to data & civic tech. Help fund our R&D work https://t.co/4o47pJxOZK pic.twitter.com/vBwUapAAVT
— Sinar Project (@sinarproject) June 7, 2017
Don’t forget to RT if you liked it too.
That’s all for this week. Have a great weekend!
Cheers, Mark


