Welcome to this week in Neo4j where we round up what’s been happening in the world of graph databases in the last 7 days.
Featured Community Member: Alessio De Angelis
This week’s featured community member is Alessio De Angelis, an IT consultant at Whitehall Reply for projects held by SOGEI, the Information and Communication Technology company linked to the Economics and Finance Ministry in Italy.

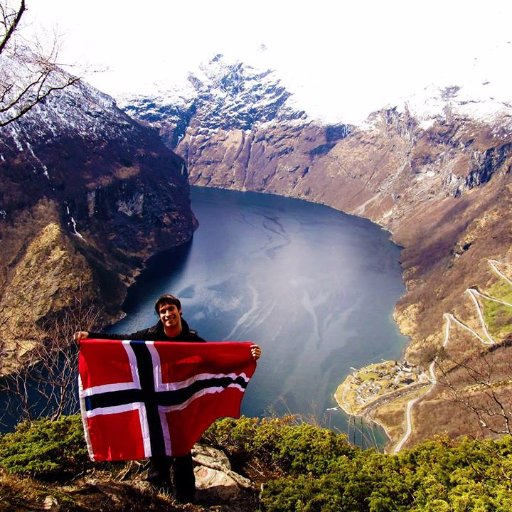
This week’s featured community member: Alessio De Angelis
Alessio first came onto the Neo4j scene while taking part in a GraphGist competition a few years ago and created an entry showing Santa’s shortest weighted path around the world.
More recently Alessio has been blogging about APOC and also featured on Rik van Bruggen’s Graphistania podcast.
Querying the Neo4j TrumpWorld Graph with Amazon Alexa
The coolest Neo4j project of the week award goes to Christophe Willemsen, our featured community member on 2 April 2017.
Christophe has created a tool that executes Cypher queries in response to commands issue to his Amazon Alexa.
Rare diseases research, APOC spatial, Twitter Clone

Rare diseases research using graphs and Linkurious
- Linkurious partner SciBite explain how they’ve been able to use graphs to combine complex data from multiple sources to help solve the challenges of rare diseases research.
- Max De Marzi is back with parts seven and eight of his building a Twitter clone series in which he builds a front end application to go with the back end system he’s built over the last couple of months.
- Michael Morley shows how to use the spatial features in the APOC library to create a map view of a Neo4j graph.
Online Meetup: Planning your next hike with Neo4j
In this week’s online meetup Amanda Schaffer showed us how to plan hikes using Neo4j.
There’s lots of Cypher queries and a hiking recommendation engine, so if that’s your thing give it a watch.
From The Knowledge Base
This week from the Neo4j Knowledge Base we’ve got an article showing how to improve the performance of a query that counts the number of relationships on a node.
On the podcast: Andrew Bowman
In his latest podcast interview Rik van Bruggen interviews our newest Neo4j employee, Andrew Bowman. You’ll remember that Andrew was our very first featured community member on 25 February 2017.
Rik and Andrew talk about Andrew’s contributions to the community and Andrew’s introduction to Neo4j while building social graphs for Athena Health.
On GitHub: Graph isomorphisms, visualization, natural language processing
There’s a variety of different projects on my GitHub travels this week.
- Rui Jia created subgraph-isomorphism-neo4j, which given a query graph and a target graph will calculate all possible subgraphs of the target graph isomorphic to the query graph.
- Julian Woodward created visual-knowledge, a visualization library using vis.js. Julian also has a cool demo of the library showing how artists are connected to each other.
- Dan Kondratyuk created graph-nlu – a library which builds a graph based on the output Python’s NLTK library and then uses it to make predictions.
- Ed Finkler created osmi-survey-graph – a project to import and analyse the 2016 OSMI Survey results in Neo4j.
Next Week
It’s GraphConnect Europe 2017 week so the European graph community will be at the QE2 in London on Thursday 11th May 2017.

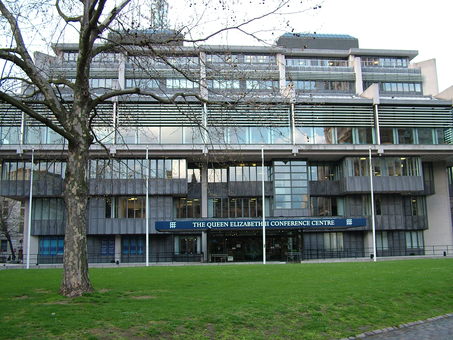
The QE2 in London, the venue for GraphConnect Europe 2017
If you would like to be in with a chance of winning a last minute ticket don’t forget to register for our online preview meetup on Monday 8th May 2017 at 11am UK time.
We’ll be joined by a few of the speakers who’ll give a sneak peek of their talks as well as talk about what they love about GraphConnect.
Hope to see you there!
Tweet of the Week
I’m going to cheat again and have two favourite tweets of the week.
First up is Chris Leishman sharing his favourite font for writing Cypher queries:
New favorite font for writing Cypher in! Fira Code – monospace font with programming ligatures: https://t.co/kofvVdXKfd #neo4j #cypher pic.twitter.com/oEDJxXLoKZ
— Chris Leishman (@cleishm) April 29, 2017
And there was also a great tweet by Caitlin McDonald:
“Dancing Graph” https://t.co/ldmN6kDj5S on @LinkedIn My early experiments using @neo4j to graph #socialnetwork data about a dance company.
— Caitlin McDonald (@caitiewrites) April 29, 2017
That’s all for this week. Have a great weekend and I’ll hopefully see some of you next week at GraphConnect.
Cheers, Mark


