Transforming Health Information Technology with a Knowledge Graph

Surgeon, Savannah Vascular
11 min read

Editor’s Note: This presentation was given by Christopher Wixon at GraphConnect New York City in September 2018.
Presentation Summary
Christopher Wixon is an established vascular surgeon based in Savannah, Georgia. However, not too long ago, he was reconsidering his place in the medical world.
Wixon was undergoing burnout, which is common for medical practitioners. He was especially frustrated with existing electronic data entry tools – specifically the Electronic Health Record. These tools, which were designed to aid him, ended up working against efficiency and simplicity.
Wixon began to wonder if the industry was approaching electronic data entry incorrectly. Instead of attacking the challenges of the Electronic Health Record head on, he decided to integrate graph technology with health information technology.
The transition to graphs started slowly, first with the use of concept models. The nodes in the graph corresponded with various components of the Electronic Health Record. They also told the system how a resource could be used within a medical application.
In this post, Wixon dives into a clinical and an orthopedic example of how graph technology aids both physicians and patients, specifically by increasing expediency in the retrieval of information and the process of diagnosing patients.
These examples illustrate just how large graphs can grow in all fields of medicine. In fact, Wixon believes graphs could be extended to represent the entire human condition. Currently, he is collaborating on a graph with 1.5 million clinical concepts.
Looking forward, Wixon remains hopeful about the future of graphs in aiding medical professionals. He believes that through graphs’ ability to participate in medical encounters, graph technology will continue to enable less experienced clinicians to function at the top of their credentials.
Full Presentation
My name is Christopher Wixon. I’m excited to share my experience creating a knowledge graph for the healthcare industry.
Professional Background
Unlike many of the accomplished data scientists whose work is usually published in Neo4j’s blog, I’m merely a practicing vascular surgeon. I’ve been in practice for approximately 20 years; during this time, I’ve had the opportunity to care for numerous patients with both life- and limb-threatening problems. It’s truly gratifying work.

I want to emphasize the magnitude of the decision that I made approximately four years ago, in which I contemplated quitting the practice of medicine.
Like many other physicians, I was tired and angry, experiencing a classic case of burn out. Statistics of burnout are shown in the image below.

Before quitting, I asked myself one of the most obvious questions: Why was I so unhappy? After all, I had many tools at my disposal. These amazing tools allowed me to diagnose patients at early stages of their illnesses and then treat those problems with increasingly minimal invasive techniques.
However, the Electronic Health Record – which I used to electronically store my patients’ health information – was not one of those tools that I enjoyed.
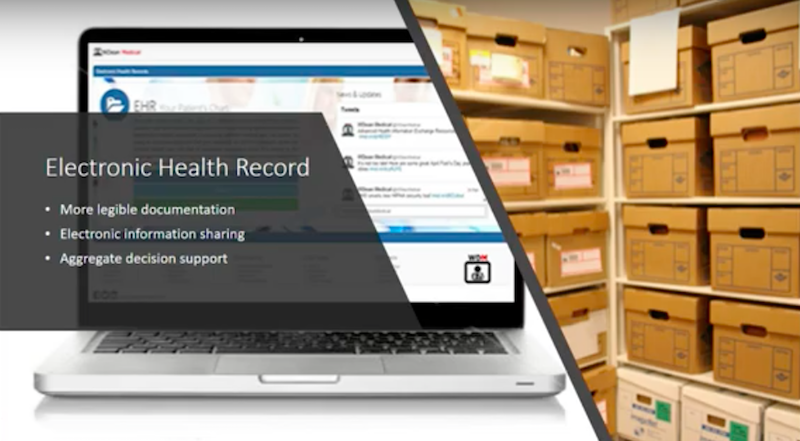
At first, the implementation of the record seemed practical. After all, who would argue with a process that advocated for legible documentation, electronic information sharing and aggregate decision support? However, soon after implementation, I came across the unintended consequences of the Electronic Health Record.
The Challenges of the Electronic Health Record
As it turns out, electronic data entry is loathsome, soul-crushing work.

The system causes disruption to patient-physician interaction and is the proximate cause of widespread physician dissatisfaction. Concurrently, the promises of improved outcomes and reduced health care costs are elusive.
Ironically, my discontent with the current system allowed me to pursue a graph database that I hoped would contribute to the health information technology industry.
Early on, I spent time developing customized templates that fit the electronic health record format. These templates looked much like the one in the image below.

However, no matter how much time I spent, the system remained confusing, inefficient and failed to adequately capture the essence of patients’ illnesses. Although I didn’t realize it at the time, these templates provided formative lessons in data modeling.
Now, before I get too far down on the Electronic Health Record vendors, I’d like to say that its inefficiency is not necessarily their fault alone. As Henry Ford once famously said: “If I had asked people what they wanted, they would have said faster horses.”
Similarly, in an effort not to disrupt physicians’ workflows, designers of the Electronic Health Record mimicked workflows around traditional paper medical records. That is to say, the newly-founded health records were simply designed to serve as faster horses. They gave the medical industry precisely what they asked for, but not what they ended up needing. I knew that there was a better way.
Key Concepts
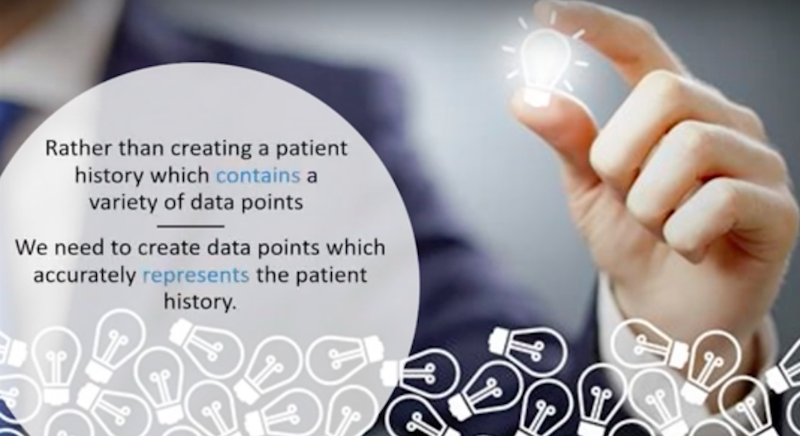
Here is the key concept in my mind: history contains a variety of data points, so why not create data points that accurately reflect the patient’s history?
For me, this was an epiphany. Healthcare data is complex; they exist in multiple locations, they’re both structured and unstructured, they have inconsistent definitions and they are constantly changing due to regulatory bodies.
Below are a few of the most commonly used terminology systems by the healthcare industry.

Such systems are integral to health informatic systems, as they support the representation of detailed clinical concepts in a computable manner.
However, the terminology does nothing on its own. The terminology only represents a single component needed for the solution for an effective medical record. To benefit from it, the terminology must be implemented and used as an integral part of the application.
So, I thought, what if we did just that? What if we used the patient’s problem as the core of our system?
Integrating Problems into the System
I thought that if we could pre-coordinate medical knowledge in a clinically relevant manner, then we could enable documentation by semantically navigating the graph.
I spent a lot of time on the white board developing convoluted models that looked a lot like the one below.

At this point, I was lost in data and it was pretty messy stuff. I had to remind myself that the graph was being built to accomplish a particular objective: documenting a patient’s medical history.
As such, in order the facilitate usability, the underlying schema needed to be purpose-driven. It also needed to be consistent and efficient for the user.
The Transition to Graphs
After spending a lot of time on this problem, what emerged was the concept model, or meta model, shown below. This model represents clinical concepts in the universal and economical matter.

Here, the key concept is the use of attribute nodes, which correspond to various components of the Electronic Health Record.
The attribute nodes serve as a pointer function to tell the system how a specific resource should be used in a particular medical application. While the model appears to be relatively simple, we found it to be incredibly expressive.
The best way to show the model’s effect is conveyed through an example that demonstrates the relationships between clinical concepts.
A Clinical Example
Let’s say that we want to associate a medical diagnosis like carpal tunnel syndrome with a concept called hand weakness. This is illustrated below:
First, we create a direct relationship between the two nodes. Then, we use the attribute “symptom” to describe the relationship between the concepts. Also, since our resource nodes in the model are bound by this nomad ontology, all superclass concepts are inherited by the resource node.
Another aspect of the model that I appreciate is that it permits nodes that do not contain explicit content. Rather, it allows the graph to recommend data that’s not explicitly entailed. This kind of relationship is highlighted in the image below:

For example, as part of a patient plan for carpal tunnel syndrome diagnosis, the physician wishes to make a referral to an orthopedic surgeon. Instead of creating explicit relationships between tens of thousands of orthopedic surgeons, we’re able to launch a node that references an APOC spatial query to locate all the physicians labeled as orthopedic surgeons. The node is also able to have the criteria of sharing the location of the orthopedic surgeons with the user.
The next step would be to include provider networks as part of the recommendation engine. Also, since the captured data is fully structured, we delegate the responsibility of processing the patient referral to the computer.
We’re also able to reiterate this process with prescription medicine, scheduled tests and procedures. By using the APOC spatial query, we can look for pharmacies, testing centers and hospitals that share their geolocation with the patient.
Before introducing more examples of the graph in action, I want to briefly discuss ranking functions, which are especially important when creating the knowledge graph. Ranking functions were something we actually hadn’t thought of when we first developed the graph.
Imagine using the graph to perform a faceted search on the term “metacarpal fracture,” like the graph shown below.

Obviously, if alphabetical order doesn’t make sense to the user, it also doesn’t make much sense to delegate “index” as the first term on the returned payload.
In this way, sibling concept nodes need to be presented in a contextually-ordered manner that’s relevant in the healthcare sector. Therefore, concepts are more likely to be ranked by size, severity, anatomic site or frequency of use. This is something that a domain expert needs to provide when curating the graph.
How large can these graphs grow ?
Even if we represent concepts in a clinically relevant, economical and orderly manner, obvious questions arise. Is it possible to truly map the entire human condition? If it is, would the model be too complex to be practical?
In order to build a tool that maps the entire human condition, you’re going to need a domain expert. Specifically, within the healthcare industry, you’re going to need a team of experts. A challenge that we currently face is that these people tend to be in short supply, and they generally tend to be unavailable.
To date, we’ve built a graph that contains approximately 1.5 million clinical concepts. This graph is shown below.

These clinical concepts are connected by about five million relationships. The graph contains most of the information in the fields of general medicine, cardiovascular medicine, orthopedics, neurology, renal medicine and soft tissue. We’re still expanding the graph nearly every day.
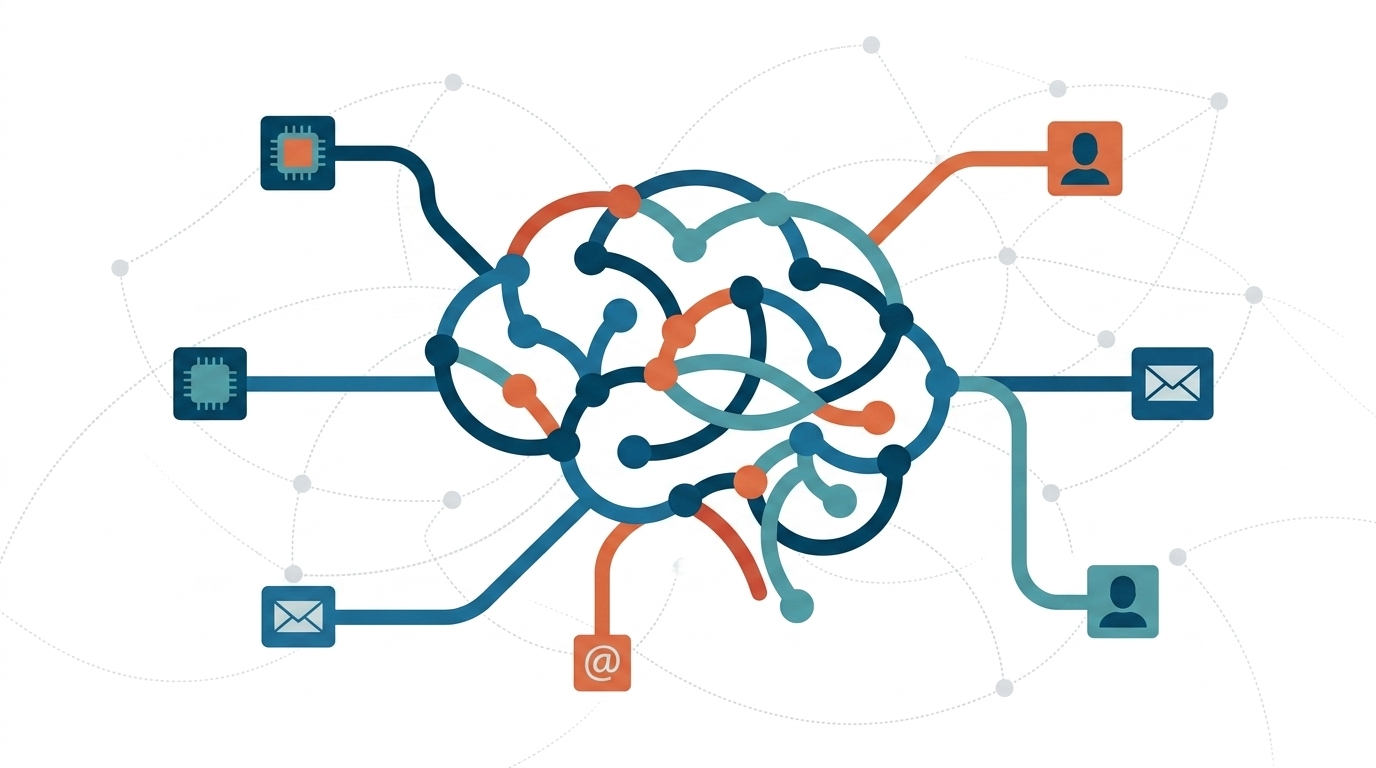
An aspect of the knowledge graph that I really appreciate is how it provides means for expert physicians to communicate knowledge effectively and precisely.
For instance, with the knowledge graph, the gray-haired expert physician shown in the upper left-hand corner in the image below is able to transfer knowledge to a less experienced user.

Cases like these occur often in medicine. A doctor might see a patient whose needs do not fall strictly within their domain. However, the data encoded in the graph is now able to assist the doctor by providing lists of potentially appropriate diagnostic and therapeutic decisions.
Now, we finally arrive at the fun part of the blog post. I have a couple examples to show you how this might work.
An Orthopedic Example
Let’s say the user of the knowledge graph is an orthopedic surgeon. He’s away from his office, perhaps in the operating room. For billing purposes, he needs access to the diagnosis code associated with a broken leg. Surprisingly, there are approximately 3,000
ICD-10 codes associated with this injury.
One method would be to utilize a reference book that looks a lot like the yellow pages and look for the code, which is extremely tedious.
So, for this use case, we designed a smartphone application for the data contained in the graph. A simulation of this application is shown below.
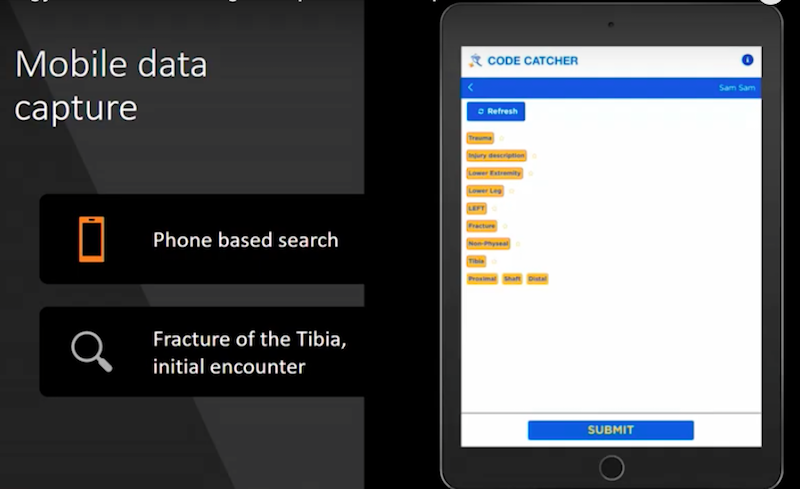
The surgeon first chooses the patient; then, the app drives through the decision tree in order to arrive at the appropriate code. It then quickly runs through the code using a very short number of nodes to choose from. Then, it arrives at an actionable node associated with the particular entity.
To provide context to the user, previously-selected nodes remain visible on the interface. Since this portion of the graph is arranged in an acyclic manner, if the user finds themselves on the wrong branch of the tree, it’s easy to go back up and explore a different branch without getting lost. Alternatively, the app also supports a faceted keyword search method.
Below is a very preliminary iteration that demonstrates how a user would interact with the graph in order to document an entire patient’s visit.
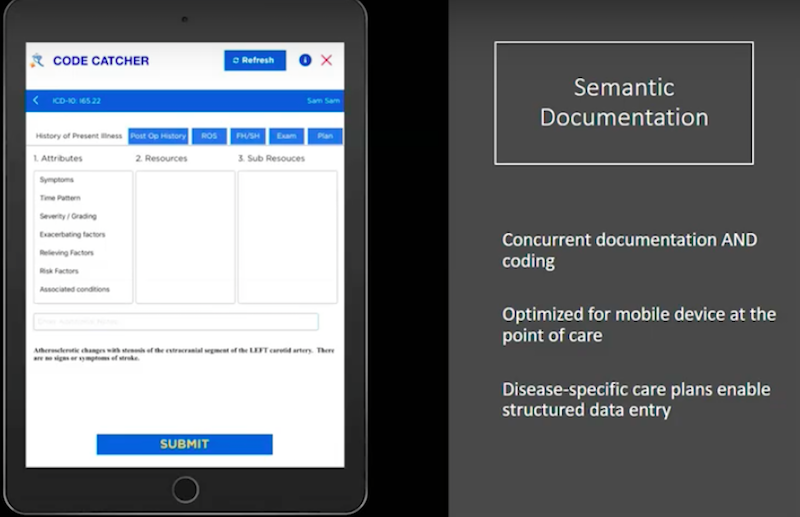
We purposely tried to create an efficient user interface that is devoid of extraneous information. Context comes from the data itself, not from the interface.
As noted earlier, the meta model of attributes corresponds to typical components of the physician’s encounter, such as history of present illness, physical examination, review of systems and future plans. Each of these components have attributes that correspond to the items in column one, as shown on the left in the image above.
In the image below, the diagnosis in the blue bar is carotid stenosis.

We ask the user to document the different categories throughout the Electronic Health Record. We then go back to history of present illness, and we ask about the patient’s particular symptoms.
The system then delivers disease-specific symptoms to the user, who then documents whether the symptom is in the affirmative or the negative. The idea is to allow the system to participate in taking in medical history at the point of service, without being mentally distracting to the user.
In the pane below, the history is documented concurrent to the navigation. Upon completion, the system generates both human and machine representations of the data, and the encounter is immediately interoperable via a fire-compliant API.

Another benefit of the graph is that it is used to store the clinical information that was captured. Storing the information in a graph format enables the array of graph algorithms to look for unrecognized patterns that exist in the data.

Perhaps at GraphConnect 2020, I’ll be able to show this to you.
Conclusion
I was fortunate enough to emerge from burn out before throwing in the towel and quitting my medical practice altogether. Unfortunately, we continue to lose a number of good physicians due to the Electronic Health Record process.
If we truly hope to modernize our healthcare system through improved outcomes and reduced costs, we must acknowledge that healthcare is a data-dependent industry.

Goals like machine learning and value-based healthcare depends on representing concepts in a reliable, complete and computable format. And perhaps, the medical knowledge graph could provide as the necessary panacea. The knowledge graph offers significant advantages over traditional symptoms, one of which is the speed at which the transactions occur.
Latency is a very annoying process. As you’re going through an Electronic Health Record, the time between clicks and the graph database is probably the fastest platform out there. Knowledge graphs provide a method of storing clinical information suitable for pattern recognition algorithms, and facilitates the delegation of tasks like scheduling and prescribing to the computer.
In addition, graphs participate in the medical encounter and keep the user focused on the problem at hand. It enables the use of lightweight devices, such as tablets. Most importantly, it allows less experienced clinicians to function at the top of their credentials.
Share Article


Explore
Related Articles
A Knowledge Layer For Your Agentic Systems on Google Cloud

The Context Gap: Why Your Smart-Sounding AI Struggles to Reason
From Data to Intelligence: Why Every Enterprise Needs an AI Knowledge Layer

Why Healthcare CIOs Can’t Afford to Scale AI Without a Knowledge Graph Foundation