
Transforming Innovation: Digital Twin for the Win!
Chief Scientist, Neo4j
7 min read

Editor’s note: This presentation was given by Jim Webber at Connections: Knowledge Graphs for Transformation.
As Neo4j’s chief scientist, I have been working on a report on knowledge graphs, and one of the things that really captured my interest in writing this report was the notion of digital twin and what it can do for your business.
I’ll start by defining what a digital twin is, where it came from, and the current state of the art. Then, I’ll look at some of the difficulties and types of implementation quagmires you can get yourself into when moving towards knowledge graphs and digital twin. Finally, I’ll discuss knowledge graphs specifically for digital twin by taking a look at how some folks out there have built digital twins atop their knowledge graphs or atop Neo4j. If this piques your interest, keep reading.
What Is Digital Twin?
“Digital twin” was a term coined in 2002 by Michael Grieves at the University of Michigan. It was popularized in 2010 by NASA’s Principal Technologist, John Vickers, but its roots stretch back decades in computer science, particularly in modelling and high-performance computing.
Wikipedia defines digital twin as “a virtual representation that serves as the real-time digital counterpart of a physical object or process” or “product drawings and engineering specs, progressed from handmade drafting to computer-aided drafting/design to model-based systems engineering.”
What’s interesting about these definitions is they assume the “real item” is some physical object. So, when I read this, I have in mind things like jet engine turbines or jet engine turbine funds, and it invokes the idea of the digital twin being a counterpart to this real physical object.
This is good and in fact part of the heritage of digital twin; however, it turns out that some of the most complex systems in the world are made out of software and people. We can apply the same digital twin techniques to these vastly complicated systems of software and people and gain value from understanding how they work, how they might fail, and how they might evolve, just as much as, in the past, we’ve gained value from understanding how a physical engine or bridge might fail or evolve.
Let’s Talk About the Weather…
A weather forecast is a commonplace digital twin of the real world environment. If we take data from the real world, we can create a model, and then we can ask how that model might evolve to learn, for example, that it is going to rain tomorrow. I live in London, which means it is always going to rain tomorrow, so I imagine that makes the maths easier here. Where does this leave us in terms of the state of the art?
State of the Art
Since 2010, here at Neo4j we’ve seen digital twin crop up again and again, always, it seems, in combination with the notion of a knowledge graph. Here are some examples:
- large complex software systems based on microservices
- power generation, such as optimizing wind turbine servicing
- in transportation, such as plotting routes around London using the London Underground, the Tube, etc.
- in pandemic response
The future is here, but it is unevenly distributed. For instance, NASA used its digital twin and knowledge graph technology to get to Mars two years early, which is phenomenal, but most folks struggle with implementation complexity. Most of us don’t have a local supercomputer lab or supercomputer models that we can continuously run. So what do we do?
We default to data tech to help us. If I can build data and pry from the data some useful information, that could be a digital twin, but it turns out that a lot of data technology is quite poor at dealing with complex interconnected domains. The models aren’t really suited for it, because the models are better suited for rows or documents or simple keys and values.
Implementation Quagmire
In fact, we fall into this implementation quagmire. High-performance computing and relational databases allow us to work with an old school digital twin, where we can throw tin at the problem for the high-performance computing stuff, or we can simplify the model to work in a relational database. In fact, jet turbines are complicated, but they can be held in a single CAD model. We do hit a wall when we try to scale this up for other use cases.
Trying to build and maintain models with incredibly complex schemas is difficult, prone to errors, and computes slowly. When we try to make sense of these models, we often run into the JOIN bomb problem; that is, as we join through these tables, the level of pressure that we place on main memory, and ultimately on virtual memory, spills over to disk, which means that we chug along at a terrible speed.
Your relational database is fine when you’re just doing a simple JOIN across a couple tables, but it becomes terrifying and completely non-deterministic whether a query will even finish in a reasonable time once you start joining multiple tables. The underlying mathematics just can’t deal with the complexity of the modern world. Therefore, we turn to knowledge graphs to support our digital twin.
Knowledge Graphs for Digital Twin
Graphs are a data structure well-suited to highly interconnected domains. Graphs can be processed (computed, stored, queried) efficiently on modern hardware. At Neo4j, we make no secret of the fact that when you’re doing a graph query, all you’re really doing is chasing pointers around a network. This fetch-execute cycle with pointer resolution is something that modern computers do very well. We can take our model, and if we translate it into a graph representation, then we have a good chance of being able to master the complexity.
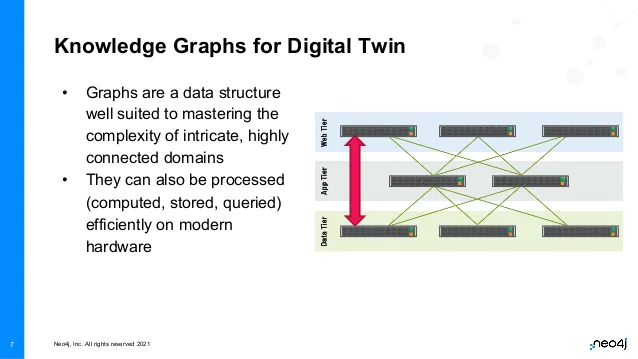
Here we have a classic three-tiered service software system, with a web tier, an app tier for business logic, and a data tier, which may or may not be a graph. We can have rules for this system, for example, that any server is only allowed to communicate with its direct neighbors (web tier can only communicate with the app tier, app tier can communicate up and down both to the data and to the web tier, etc.).
If we observe interactions that might violate this rule, it could be a security problem. The problem could also be a developer that took a shortcut and tightly coupled the user interface code down into the data tier, but it equally could be an indication that we have some kind of security violation, and we want to be immediately alerted that a rule has been broken so that we can take action.
Case Study: Lending Club
A great example of a digital twin on top of a knowledge graph comes from Lending Club, which is a peer-to-peer lending company in the U.S. Their knowledge graph captures their expansive, microservices-based architecture. Several hundred services all interact to provide this peer-to-peer lending marketplace. The underlying knowledge graph listens to all of the systems around the network, including the microservices themselves and the underlying servers, switches, and rack the microservices all need to operate. This real-time view of the world is piped into the knowledge graph.
The knowledge graph provides a central view of events and metrics, all tied together so that an operator can make sense of a connected domain as it unfolds. What’s nice about this is the knowledge graph that they have, we can treat as a digital twin.
Not only can we play real-time events coming from the systems against it and look at how it evolves, but we can also ask it, “What happens if this router dies?” and we can see as it ripples through the graph which applications, which customers, or which loans will ultimately be affected by this. So you can use this captured data from the real world to ask questions about how things might go well and how things might go wrong. A useful question to ask for modern systems is, “Where are my single points of failure at the moment?”
Vertical Opportunities
McKinsey reckons that by 2025, IOT technology, small sensors connected to the internet, will grow from about $4 trillion a year to $11 trillion a year. This raises the question, “Where does the data go?” A lot of this raw, sensor data is going to end up in data lakes and in time series databases, which are fantastic places to store raw data.
When it comes to modelling, those kinds of databases aren’t ideal. Instead, what we need to do is put a knowledge graph layer atop these raw or bulk stores and raise the level of abstraction. Then we can start asking this smarter data some smarter questions. This is the bedrock for building a digital twin.
IOT systems have sensors scattered around the planet, ultimately sending data to our knowledge graph. We have our digital twin that we can use to ask questions about what would happen in certain scenarios. This gives us vertical opportunities. We can take this pattern into a wide array of domains: asset tracking, building and engineering maintenance, transport or cargo tracking, operations management, oil and gas flows, financial flows, and compliance.
Raising the level of abstraction from bits and bytes captured from small sensors to a knowledge graph digital twin can create a lot of value.
Share Article


Explore
Related Articles


How to Improve Multi-Hop Reasoning With Knowledge Graphs and LLMs


