
Transforming the Enterprise: AI at Scale with Neo4j


19 min read

Editor’s Note: This presentation was given by Michael Moore and Omar Azhar at GraphConnect New York in September 2018.
Presentation Summary
EY has embarked upon an ambitious graph enterprise AI and machine learning initiative to more effectively uncover fraudulent activities for their customers. They’ve chosen graph technology for this purpose because they are simple visual constructs, a natural fit for semantic information and speed up the development process for enterprises. The technology is becoming increasingly popular because the cost of computing has fallen precipitously over the last two decades, and graphs provide the perfect scale-up solution for cloud-based storage.
Almost all use cases that benefit from graph technology involve connecting data across multiple domains with processes that rely on relationships and dependencies to uncover patterns. This includes solving the challenging customer 360 use case, which relies on a graph recommendation engine; the B2B use case, which relies on efficient Master Data Management; and the financial use case, which relies on the identification of abnormal patterns.
For financial use cases, EY is working towards applying AI and machine learning to the output from their graph models to assign additional context, inferences or domain knowledge that help companies make better and more efficient decisions. And there’s no better tool than a knowledge graph to achieve these goals.
Full Presentation: Transforming the Enterprise: AI at Scale with Neo4j
What we’re going to be talking about today is how Ernst & Young (EY) is preparing to take advantage of graph enterprise-AI and machine learning at scale:
Michael Moore: We’re going to start with a basic overview of Neo4j, graphs and big data, including why graphs are becoming more and more popular.
Then we’re going to turn to the graph use cases and schemas that we typically see with our clients, followed by a deep dive on what we consider to be the frontier of AI: using graphs to derive additional context, and then leveraging that context to build better models.
We’ll conclude our presentation with a few tips on getting started.
The Growing Popularity of Graphs
We have a massive analytics practice at EY with thousands of consultants deployed in various sectors. We think the graph database is a transformative technology, and that the next generation of analytics will be based on machine reasoning derived from graphs. We also estimate that in about a decade, 50 percent of all SQL workloads will be executed on graphs.
So where do graphs fit in to the database landscape?

On the left side of the above graphic, we have the traditional databases and data warehousing that was designed 20 or 30 years ago when compute power was at a premium.
Other databases in the NoSQL universe include document databases like MongoDB, key value databases like redis for limited high speed querying, and wide column stores like Apache Hbase.
And then you have Neo4j, which is the most enterprise-ready of all of the graph databases, and which can talk to all of the above databases.
Why are graphs becoming so popular? Because over the last 25 years, the cost of computing has been falling precipitously:
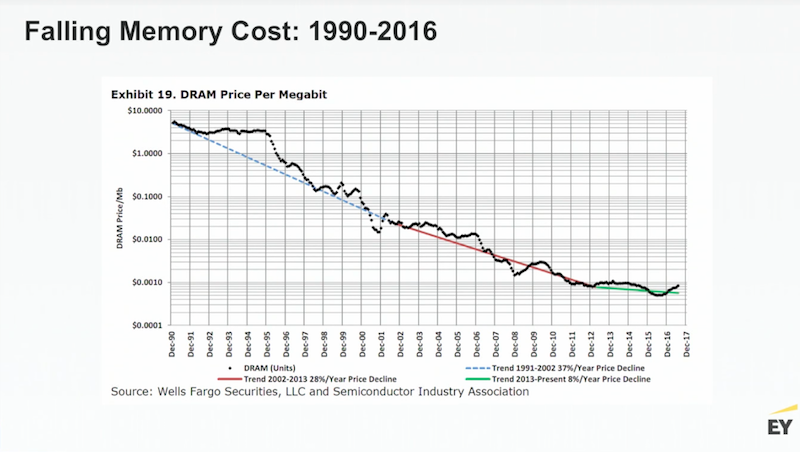
This has driven some amazing opportunities. Last year, AWS started offering single machines with four terabytes of memory for a little more than $10 an hour. This allows an entire data fabric to sit in a single environment with incredibly fast performance, especially compared to a network of distributed commodity machines. Microsoft recently Microsoft released Azure, which offers virtual machines with up to 12 TB of memory.
Five years from now we could have cloud-based servers with 100 terabytes of memory, or maybe even a petabyte of memory – and Neo4j provides the perfect scale-up solution.
Even though graph databases only make up about 1.3 percent of the database market share, they are driving the most growth and interest from our community of practitioners:

Ultimately, I think big RAM and big graphs are going to eat up the traditional relational database space. Relational databases still have a place for things like ERP systems, but today, companies are competing on speed and relevance. To be relevant, you have to know a lot about the context, which includes views that cut across a large number of data domains – a function performed excellently by graphs.
What Is a Graph?
Let’s answer the important question: What is a graph? It’s a simple visual construct that has been around for a long time. And graphs are a natural fit for semantic representation that’s easy to develop and understand.
Below is a graph of a single email from the eCommerce ecosystem:
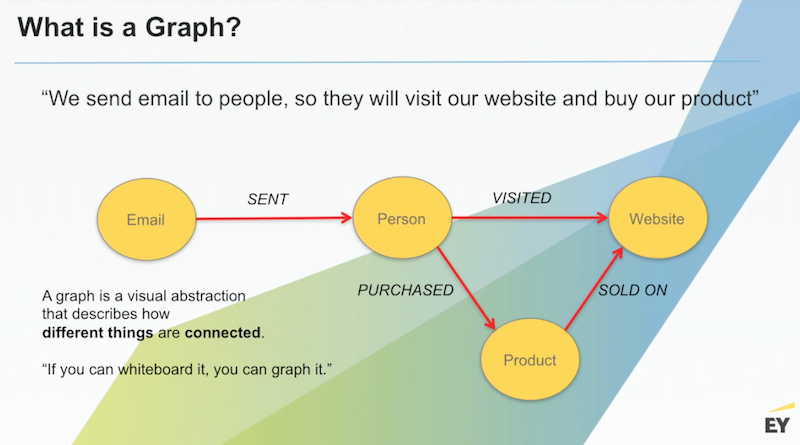
In this graph, which actually represents billion-dollar businesses like eBay, we send emails to customers to drive them to our website and buy our products, which we want to ensure is actually in stock.
We need to be able to answer the following important business question: How good are we at getting people to visit our website and buy our product?
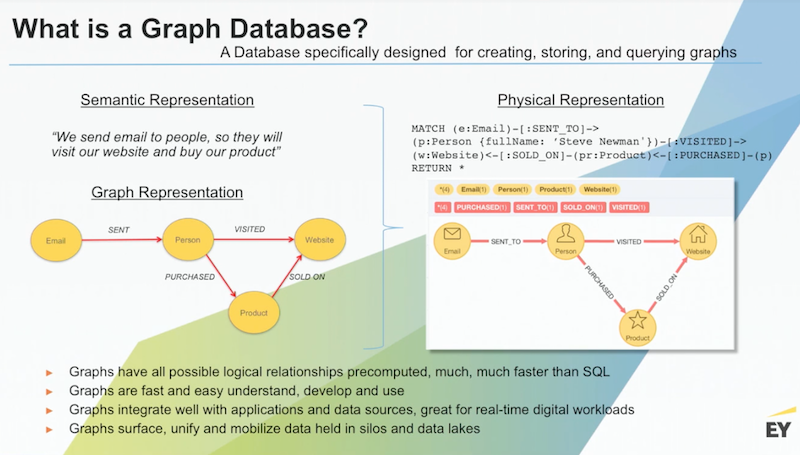
To answer this question, we run analytics and build a graph, which presents the same way in the database as it is drawn above:
This provides the ability to have much richer conversations with your business leaders, and find out: Did we get this idea right? Or did we miss something?
Leaders can look directly at this schema and let us know whether or not we’ve left out an important process or step. The ability to have these conversations quickly and easily speeds up our development.
Traditional databases rely on keys and tables, and you have to be a bit like a bricklayer. To do a query, you have to look at huge data tables, figure out what keys need to be joined, and write the corresponding query. Anyone who has done this kind of work knows you can’t run a query that goes past three or four tables, largely because you consume a huge volume of runtime memory.
Compare this to graph databases, with searches that are a bit more like a snake going through grass. Let’s take a look at the Cypher query in the top right of the above slide.
We want to match all the emails sent to Steve that drove him to visit the website and purchase a product. This single statement replaces an SQL correlated subquery in a very compact way that also represents a traversal path. When the database conducts a search, for every pattern where this path is true, the query will return a row of data. And the great thing about Cypher is that a very simple query allows you to run interesting and sophisticated queries.
Graph Database Use Cases
There are a huge number of use cases in the graph space, with more showing up every day:

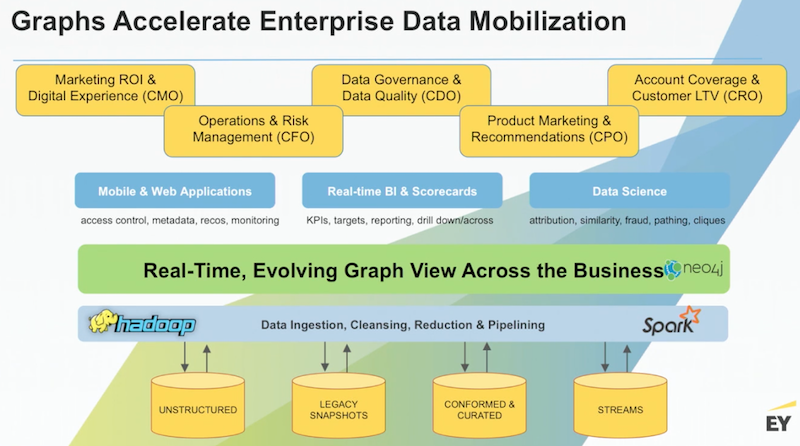
Data lakes are great at ingesting data, typically unstructured data, and there’s a lot of great work that can be done in this space. They have entire snapshots of huge Oracle databases that maybe haven’t been explored, or they can contain really important conformed and curated data. You can also use Kafka Streams or Kinesis Streams to continually flow this data into that warehouse.
So while data lakes are really great at ingesting data, they’re not good at the syndication, distribution or export of data out to the edges in a common format.
But placing a graph over data lakes provides a common data fabric that allows you to pull up and connect important data, and through the use of Neo4j APIs, you can drive a number of applications. You can also write your own Java for some of the more difficult tasks, which is something we do for a number of our clients.
Neo4j is also fully extensible, and works for use cases across marketing, risk, data governance, sales and marketing analysis and account coverage. In all of these scenarios, you could have a business leader who has been searching for a particular view that their current data structure just doesn’t provide. In your organization that’s a cry for help – and normally points to needing a graph.
The Customer 360 Use Case
Let’s dive into a few examples, starting with the customer 360. Below is an example schema, which has our customer in the middle:
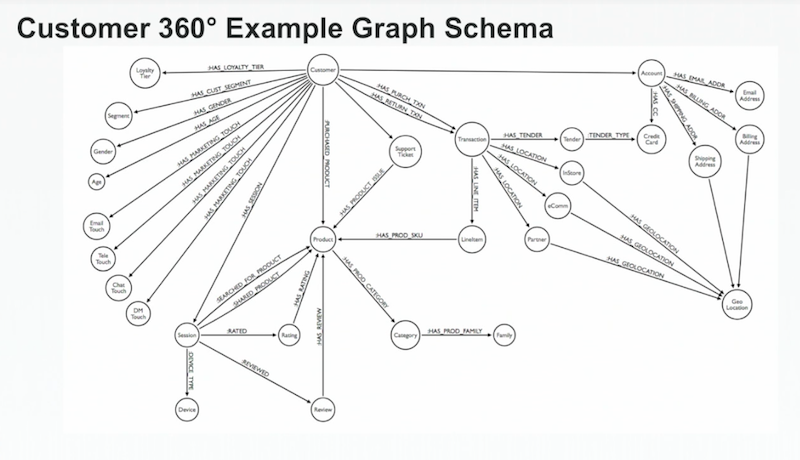
Customer 360 view is our most common use case because it’s very difficult to do.
You have customer segmentation data, marketing touches across channels, product purchasing and hierarchies, support tickets, transactions and tender methods, purchase channels, account stack and history, login information, billing addresses – and the list goes on.
It’s particularly difficult to do this in an enterprise because there are typically a dozen or more applications managing each chunk of this heterogeneous data landscape. A graph is really the only tool that can readily pull all of this data together and rationalize it.
Once you have your customer 360 view in place, we build recommendation engines and perform advanced graph analysis.
Here’s an example of an analytical graph built on top of a customer 360 graph:

Each node is a product node, and the co-purchasing probability for every pair of products has been computed in the graph. For each of our thousands of products, we’ve performed a pairwise calculation for every possible combination. The graph calculation answers the question: With what frequency are two items purchased together?
The following demo walks through the customer 360 for an online shopping database:
The below are the typical steps you might follow in a graph recommendation engine:

You build your data graph, your customer 360 graph, and all the frequency associations. Amazon credits 25 to 35 percent of their revenue to their recommendation engine, which only relies on two main relationships: customers who bought Item A also bought Item B, and customers who searched for Item C typically buy Item D. That’s it – two relationships and millions of products that are generating a huge amount of value.
Typically, you go through a set of steps that includes discovery scores and exclusions that eliminate products that are out of stock. You could also potentially boost a product because it’s being marketed, or do some final checking in the post stage to ensure you have good category and diversity coverage.
The B2B Use Case
Enterprise case studies related to the B2B customer 360 or account 360 are quite complicated:

This complexity is in part due to the fact that most businesses are amalgams of businesses that have been acquired, which results in graphs like the above.
For example, we have clients with multiple divisions that each have their own legacy sales teams and multiple Salesforce instances. When you try to do something simple like email a customer, we don’t know which customer or which email address to use because we may have four or five representations of that single customer across our systems. This relates to master data management (MDM) challenges.
In the above slide we have our customer (a business) which has contacts who are people. We explode all of the different identity elements for each one of those contacts and track the source of each identity element. This could be anything from a user-completed form, a third party, or a Salesforce record. Each of these sources will have different levels of authority relative to the construction of an end or golden record. You can assign the “probability of authority” as a relationship, dynamically query the graph, and return the most up-to-date golden record possible.
Below is the typical architecture for this type of graph:

At the lower levels you might have a semantic layer where you reconcile precisely the different field names across the different divisions that are contributing to this kind of a graph, and then you bring it up into Neo4j and hook it up to your applications.
The Financial Use Case: Uncovering the Rare and Inefficient Patterns
All our prior examples have been on the topic of common patterns, something graphs are very good at interpreting and recommending. But what about the rare patterns? Graphs are also good at finding fraud, collusion and money laundering through the identification of rare patterns.
This type of graph pattern represents a violation of what you consider to be the canonical subgraph for whatever entity you’re looking at, which is especially helpful in the financial sector.
Consider the following money laundering example:

Let’s start with the green panel. We have a company, which has a bank account, which performs a transaction to send money to a beneficiary account, which is owned by a beneficiary person. All of this looks perfectly legitimate.
But if we move to the red panel and try to link these same elements, we might see that this company has a director that works for another company with an address very similar to the company address where money was just wired to. This uncovers fraud like embezzlement, a very common use case.
Below is a representation of a generalized transaction schema:
I have transactions, and relationships that follow the directional flow of funds, accounts, parties and their associated information. All of these things can be interrogated to understand the potential legitimacy of a transaction.
Below is an example based on some real data we worked with earlier this year:
We modeled transactions as account months, built a subgraph for each of a client’s account months, and received an alert and a suspicious activity report for this particular account. We uncovered multiple transfers of $10,000 for a total of $70,000 in a single month, without any meaningful increase in the account balance. This was clearly an example of what’s known as pass-through money laundering.
The above shows a report for only a single month. When we looked back over additional historical data, we discovered that this pattern of behavior had been consistent for about 16 months:
Even though some alerts were thrown off, none of them were considered significant enough for follow-up. But in the graph, it became clear that this is a sustained pattern of money laundering.
Omar: We’re going to continue with this money laundering example, but from a more contextual perspective. Let’s start with a bit of background in the financial services sector:

From a data science machine learning perspective, we generally see that a lot of financial use cases are driven by a few core competencies capabilities:
- Transcription and information extraction, which converts all unstructured data into machine-readable formats, whether it’s call centers, calls, texts or onboarding documentation
- Natural language processing
- Knowledge graphs, which allow you to put your data in a graph topology with a machine reasoning inference, are all new capabilities that enable a lot of machine learning use cases. You’ll see how we do this for money laundering.
- Fundamental machine learning and deep learning. We separate the two because we often see that a lot of general business use cases can be solved with good data science and basic machine learning.
The enabler for all of these competencies are big data platforms, particularly Neo4j.
The Third Wave of AI: Context and the Knowledge Graph
For more context in the financial money laundering space, we can look towards the Defense Advanced Research Projects Agency (DARPA):

The first wave of AI includes rules and decision-making trees, which includes if/then statements used for tools such as consumer tax software. The second wave of AI is what we see in many current AI tools, which is statistical-based learning for pattern matching. You throw in a lot of data, it understands the distribution of the features, cuts it across and then gives you an output. This is used for tools like facial recognition software or any classification type problem.
The third wave that DARPA is focusing on is contextual adaptation. This takes the output from your second wave models and embeds additional context, inferences or domain knowledge, and then gives that information to the decision makers to actually make the decisions.
This means that it’s no longer enough to build a statistical model, get an output and make decisions based only on that. You also need to build a system or design your data in such a way that it can provide the reason for why those decisions or statistical outputs are correct, or can provide the context to do so.
And if we were to define the third wave of AI as requiring context, there’s no better data model than a knowledge graph to provide that context.
These types of graphs let you connect all your data, concepts, ideas, entities and ontologies into one very densely connected structure. Those relationships are essentially what drives contextual learning and most of the context for you to make those decisions. The more connections and relationships you make, the stronger your knowledge graphs – and the more dense the information you have at your fingertips.
Let’s walk through an example using a large bank with multiple lines of business, credit cards, mortgages and loans, with a focus on only one.
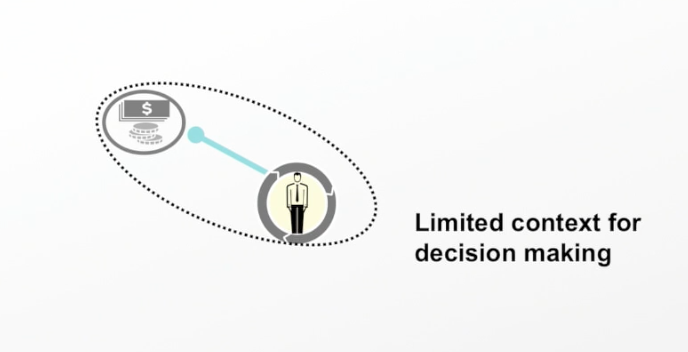
Each line of business has a variety of different operations, and this particular customer has a retail deposit account with my bank. I’m making decisions on that customer based on information only from their retail account, which provides relatively little context because this person is likely making a lot of other financial actions separate from this deposit account.
To provide more context, I can start connecting and building a classic customer 360 view using a graph database. This allows us to connect all the data we have on that customer across all the products my institution offers:

In this example, I know the customer also has a credit card and loans with my financial institution. This allows me to make decisions with a lot more context.
You can take this a little further by comparing this customer to another customer in your bank with similar types of products:

In this case, the customers are co-signers on a mortgage, which allows you to infer an additional relationship between these two customers: they likely live together. And by inferring this relationship, I’ve created an additional context in my graph. Instead of looking at each customer individually, I can start making decisions about these customers as a household. With more relationships, I have more context for my decision-making.
Using Neo4j as the database’s knowledge graph helps create that data model to surface this context all at once, which helps you make better-informed decisions.
Below is what our model looks like:
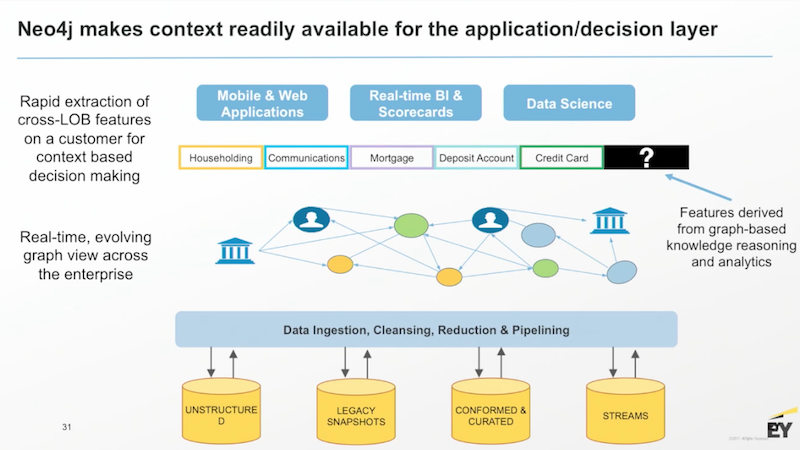
In this customer 360 use case, the graph database runs across your multiple data silos to surface all that data up for your various different decision-making or application layers. With all data in this single graph, there’s an entirely new slew of mathematics, topology and machine reasoning concepts that are now available.
New Context with Implied Relationships
This brings us to the difference between explicit and implicit knowledge. Explicit knowledge refers to the data that already exists in our database. Having all your data in one place is the first milestone, and one that many businesses haven’t reached yet:

Once you reach this milestone, the next step from an AI perspective is performing machine reasoning and inference. This includes using reasoning to add knowledge that doesn’t currently exist in your data sources:
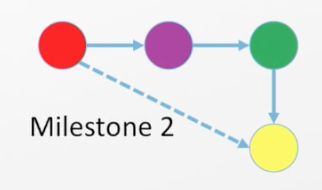
In this topic diagram, red goes to purple, purpose goes to green, and green goes to yellow. Therefore we can infer that there may be some sort of relationship between red and yellow.
So what does this mean in a real-world use case? If I have person A and they’re transacting with person B, I can infer that there’s likely a relationship between person A and person B. I can then put this into my graph:

I can take that even further by applying different information theory and network science methods to calculate the numeric probability that if personA transacts with person B and person B transacts with person C, person A and person C have a relationship.
You can start with very simple business-type logic for connecting your customers or your products together in this way, and can continue building on this through a new world of mathematics that’s becoming more readily available for machine learning and AI applications.
Now let’s go through a quick overview of some of the pain points in our anti-money laundering cases.
It’s a very rules-based process, so there’s a high number of alerts and thresholds. For example, if transactions over $10,000 create a flag, you generate a very high false positive volume – so high that it’s not possible for an analyst to go through each alert. Additionally, this activity exists in a silo of one transaction when in fact we’re dealing with a very complex, nefarious human network with continually evolving behavior that doesn’t lend well to a rule-based model. This is a hard problem to tackle in the current process.
We’re working to augment the current process by using Neo4j, big data tools like Spark for graph computation, GraphX for graph theory calculations, and Tensorflow for machine learning.
The goal is to provide analysts with additional context through the ability to view the transaction networks for any flagged transactions, and to create additional metrics to outline common, non-fraudulent transactions to bring down the volume of false positives. Eventually we can use graph analytics plus AI to build a deep learning model that can help detect structures that would uncover behavior that normally goes undetected.
Network Optimization
We’ve been optimizing networks and information flow for decades, so this isn’t really a new type of thinking. Below is our classic case of transportation hubs – Denver and Los Angeles – along with their regional airports:
We can take lessons learned from other industries and apply these network optimization principles to our money laundering use case.
Any person or company who is moving money around tries to do so in the most efficient way possible because it keeps costs lower. This rule applies whether you’re an individual trying to get a mortgage or a financial institution. We can take examples from these different industries to understand what an anomalous network looks like in the context of efficient vs. inefficient.
Let’s go back to our money laundering use case with the following graph, which is an actual structure from real-world banking assets:

Accounts in the blue nodes have created triggers (green nodes), which represent accounts that never went through. With this current structure, the analysis only looks at an individual account rather than the three connected accounts that triggered an alert.
Using graph databases, we can infer those relationships and surface that context to the analyst. This will alert them that this one account is linked to two other accounts that are just a single hop away, which could indicate something nefarious. By inferring that these triggered accounts are related, we can create mathematical and business-based rules around that to bring that up.
Let’s take that even farther to other types of money transaction networks that we frequently see. In this example we have a large number of green account nodes that have been flagged, which warrant a closer look:

But when we explore further, we see that these each represent an optimal money flow, and more likely represent something like the federal banking system. There’s a single central green bank with money dispersed outwards. We can apply mathematical calculations to identify this as a normal random dispersion of money flow.
Let’s take a look at another money transfer example:
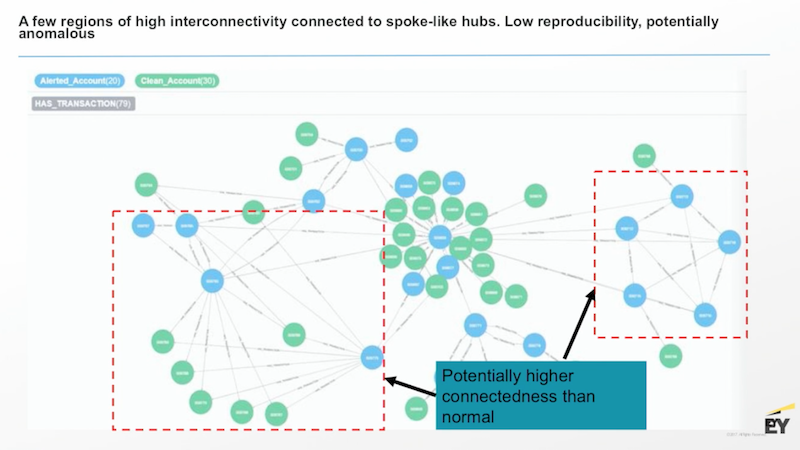
Some transactions follow a typical dispersion money model, but the red outlines point to some interconnected hubs that warrant closer inspection.
By using knowledge graphs with Neo4j along with tools like Spark, GraphX and APOC procedures, we can develop metrics to measure how normal/efficient or abnormal/inefficient our transaction network is, and infer relationships to uncover rings. The next step is to create machine learning and data science models to create metrics that bring down false positives at scale.
What’s Next: Machine Learning and AI at Scale
Below is an overview of all the features we’d like to implement at scale, using Neo4j as our underlying big data network:

This includes current AML processes and graph analytics such as betweenness and centrality measures through Spark and APOC procedures. We can also bring in features that do things like a “negative news” scrape, which would import information related to negative news coverage of an individual.
The next goal is to dive into the new field of Graph Convolutional Neural Networks (GCNNs), an experimental field related to deep learning specifically just for graph constructs.
We’re exploring this to develop a deep learning or AI-based model that can help us better understand money laundering. Our goal is to train an AI model to identify a money-laundering structure rather than identifying normal vs. abnormal structures of financial flows.
This same line of thinking can also be applied to customer to customer networks and product to product networks as well.
Ingesting your Data
Michael: Now let’s walk through a couple slides on how to do this in practice with large data.
To get data out of data lakes, you typically build large graph-form tables of nodes and mappings that would be comprised of hundreds of millions of data rows. You can zip those up, and then upload them into Neo4j through the database’s efficient high-speed loader:

I built a graph a couple years ago with half a billion nodes, 2.2 billion relationships, and nine billion properties in about an hour and a half. This is the typical performance, and it’s getting even faster.
There are also several ways to make use of advanced analytics:

You can take data out of Neo4j using whichever tool you like, and then write the results back to your graph, which allows your graph to learn over time. You can productionalize your analytics far more easily than if you have to go through all the steps of doing transformations, create a model to untransform your data, and then write it back to an SQL database.
And finally, this is how these environments can look:

You can use the cloud-based Sandbox to get going, which you’d place on top of your Hadoop in a big server that’s at least a couple hundred gigs. Then you can load up some of your favorite tools like AWS and Azure.
If you have sensitive data, you might consider using an air-gapped solution:

This is a NVIDIA DGX AI workstation, which is what we have back in Seattle. It’s not connected to the internet, and we do data and graph modeling within this system.
How to Identify Whether or Not You Have a Graph Problem
In summary, here are some questions that let you know you’re having a graph problem: How can I get a better understanding of my customers in order to create more relevant experiences? How can I effectively mobilize and syndicate the data I’m ingesting? How can I get more business value and deeper insights from the data that I already have? And what’s the next best action I can take?
This brings us to the entire purpose of graphs: to enable you to very quickly choose what is the next best action for your company.
Share Article


Explore
Related Articles


How to Improve Multi-Hop Reasoning With Knowledge Graphs and LLMs

What Are the Different Types of Graph Algorithms & When to Use Them?


