Understanding Graphs and Graph Data Science


6 min read
Graph approaches to data are exploding. In the commercial world, graph-based analysis is used to explore deeper meaning in data you already have, improve forecasts and make better predictions.
This accelerating use in business is due to the increasing connectedness of data, breakthroughs in scaling graph technology to enterprise-sized problems, excellent results when integrated with machine learning (ML) and artificial intelligence (AI) solutions, and more accessible tools for general analytics and data science teams.
In this blog, which reflects Chapter 1 of Graph Data Science For Dummies, you discover how we define a graph and the relationship of graphs to analytics and data science. You also get a sense of how graphs are used to answer tough questions.
Explaining What a Graph Is
Networks are the most common way to represent and understand complex systems. For example, you can represent how a social system works by thinking about interactions between pairs of people. By analyzing the structure of this representation, you can answer questions and make predictions about how the system works or how individuals behave within it. In this sense, network science is a set of technical tools applicable to nearly any domain, and graphs are the mathematical models used to perform analysis. Simply put,
graphs are a mathematical abstraction of complex systems.
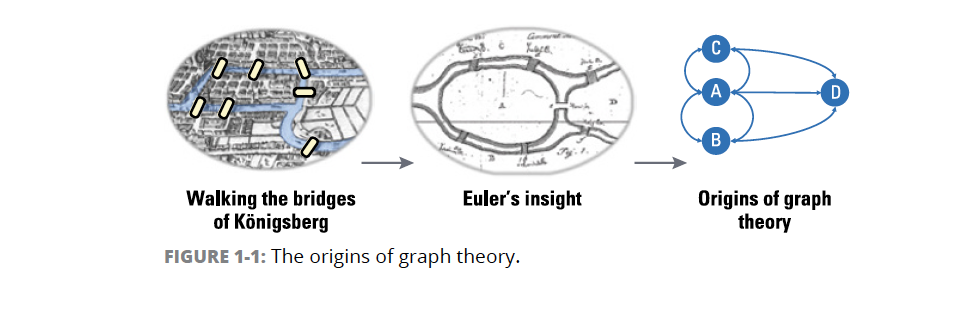
Graphs have a history dating back to 1736. Graph theory originated from a puzzle about the city of Königsberg, which included two large islands connected to each other and the two mainland portions of the city by seven bridges. The puzzle asked whether it was possible to visit all four areas of a city connected by seven bridges, while only crossing each bridge once. It wasn’t.
Leonhard Euler solved that riddle with the insight that only the connections themselves were relevant to solving this kind of problem. With that humble beginning, Euler established the groundwork for graph theory and its mathematics. As one of Euler’s original sketches, Figure 1-1 depicts Euler’s progression:
-
- Walking the bridges of Königsberg: Four main areas of Königsberg with seven bridges. Can you cross each bridge only once and return to your starting point?
- Euler’s insight: The only relevant data is the main areas and the bridges connecting them.
- Origins of graph theory: Euler abstracted the problem and created generalized rules based on nodes and relationships that apply to any connected system.
While graphs originated in mathematics, they are also a very faithful way to model data. A graph is often illustrated with circles to represent entities (nodes) and lines between them to represent relationships. Think of nodes as the nouns in sentences, and relationships as verbs that give context to the nodes. To avoid any confusion, the graphs we talk about have nothing to do with graphing equations or charts.
Take a look at the differences in Figure 1-2.
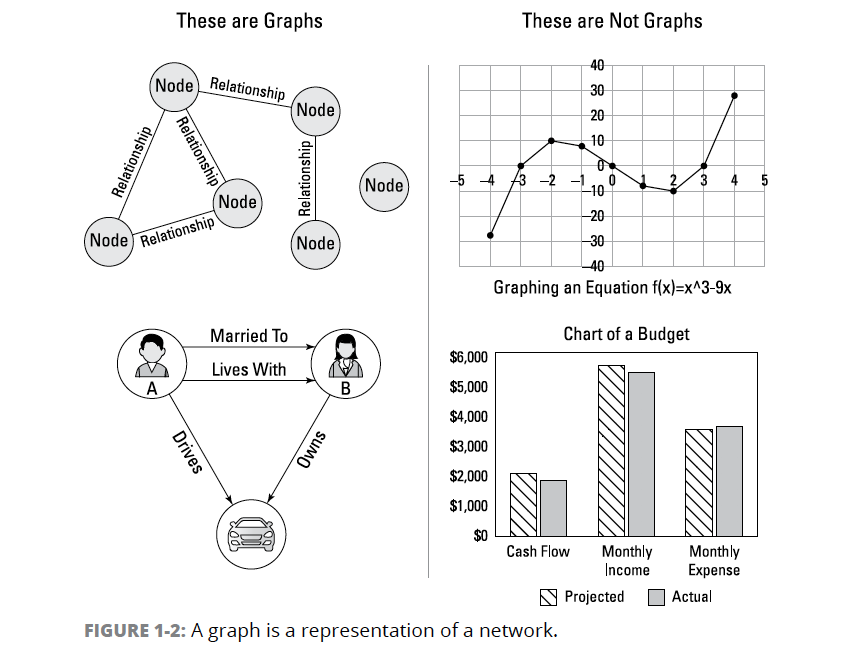
The bottom graph on the left in Figure 1-2 is a person graph. When looking at that graph, you can construct several sentences to describe it. For example, person A lives with person B who owns a car, and person A drives a car that person B owns. This modeling approach maps easily to the real world and is simple to describe, which helps align data modeling and analysis.
Defining Graph Analytics and Graph Data Science
Modeling graphs is only half of the story. You may also want to analyze them to reveal insight that isn’t immediately obvious. So in this section, we explain the domain of graph data science (GDS) and graph analytics.
GDS is a science-driven approach to gain knowledge from the relationships and structures in data, typically to power predictions. It uses workflows that may include queries, statistics, algorithms, and ML.
GDS can typically be broken down into three areas:
-
- Graph statistics provides basic measures about a graph, such as the number of nodes and distribution of relationships. These insights may influence how you configure and execute more complex analysis as well as interpret results.
- Graph analytics builds on graph statistics by answering specific questions and gaining insights from connections in existing or historical data. Graph queries and algorithms are typically applied together in “recipes” during graph analytics, and the results are used directly for analysis.
- Graph-enhanced ML and AI is the application of graph data and analytics results to train ML models or support probabilistic decisions within an AI system.
Graph statistics and analytics are often used in conjunction to answer complex questions and the subsequent insights applied to improve ML.
Looking at the Types of Questions for GDS
Data scientists use GDS to evaluate interdependencies, infer meaning, and predict behavior. At a high level, these questions fall into a few broad areas: movement, influence, groups and interactions, and patterns, as shown in Figure 1-3.
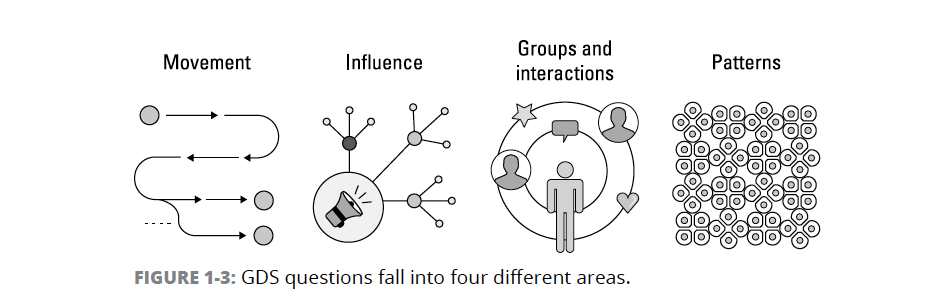
The areas in Figure 1-3 answer the following questions:
-
- How do things travel (move) through a network?
Understanding how things move through a network involves deep path analysis to find likely pathways, such as the route of diseases or network failures. It can also be used to optimize for the best possible route or for flow constraints. - What are the most influential points?
Identifying influencers involves uncovering the control points in a network. These influencers can act as fast dissemination points, bridges between less connected groups, or bottlenecks. Influencers can accelerate or slow the flow of items through networks from finances to opinions. The concept of highly connected and influential nodes in a graph is referred to as centrality. - What are the groups and interactions?
Detecting communities requires grouping nodes based on the number and strength of interactions. This method is the primary way to presume group affinity, although neighbor likeness can also be a factor. Link prediction is about inferring future (or unseen) connections based on network structure. - What patterns are significant?
Uncovering network patterns reveals adjacent correlations and can also be used for general exploration. For example, you may look for a known behavior sequence between a few nodes or compare attributes of all your nodes to find similarities. Or perhaps you want to evaluate the entire structure of a network, with its intricate hierarchies, to correlate patterns to certain outcomes.
- How do things travel (move) through a network?
Multiple types of graphs queries and algorithms are usually applied in a recipe fashion as part of a GDS workflow. For example, a query to understand the density of relationships in a graph may help determine the appropriate community detection algorithm for the most relevant results. Tactically, graph queries and algorithms are the tools for understanding the overall nature of a connected system and for using relationships in various data science pipelines.
THE RISE OF GRAPH DATA SCIENCE
Hopefully this post helps you understand why so many organizations are using graph data science: more accessible technologies, increased ability to compute over massive graph datasets, and an awareness of the power of graphs to infer meaning and improve forecasts.
And this is equally true in the research community with the use of graph technology in AI research also accelerating. In fact, in the last ten years, the number of AI research papers that feature graph technology has increased over 700 percent according to the Dimensions Knowledge system for research publications.
If this is the start of your graph journey or you need to help others get started, Neo4j has the largest, most active community and we welcome you. We look forward to sharing our expertise via books, online training and events – and we hope to hear from you.
Share Article


Explore
Related Articles

SumoDB in Neo4j: Chaining Multiple Graph Algorithms in Snowflake — Part 3


Why Machines Need Embeddings: Turning Graph Structure into Features