More Data, More Visualizations: 5-Minute Interview with Sebastian Müller

Editor-in-Chief, Neo4j
3 min read

“Graphs want to be visualized,” said Sebastian Müller, CTO of yWorks.
Developers are looking to understand the data in graph databases, explore it and create applications that offer interactive interfaces to that data. yWorks is a developer tool for creating visualizations of graph data.
In this week’s five-minute interview (conducted at GraphConnect 2018 in NYC), we talk with Sebastian Müller about the many ways developers are visualizing data in Neo4j and the future of graph visualization.
How do you use Neo4j?
Sebastian Müller: We’re in the B2B space; our customers are software developers. Developers use our tools to create something new. Just like customers use Neo4j for the storage of the data, developers can use our tools to create engaging visualizations with interactivity.
With our software, developers can create applications just the way they imagined them. They have the opportunity to configure our software so that it behaves the way they want it to behave. It gives developers the ability to realize their requirements and to see the data inside the databases in a new way. Then they can gain insight into the data and learn new things about the data.
And with the interactivity that our tools provide, developers create engaging interfaces for end users to play with their data, understand their data and do more things with it.
What do you see happening in the graph visualization space?
Müller: Many customers, with the introduction of Neo4j Bloom are starting to dig into visualization. Seeing their data brings value to them.
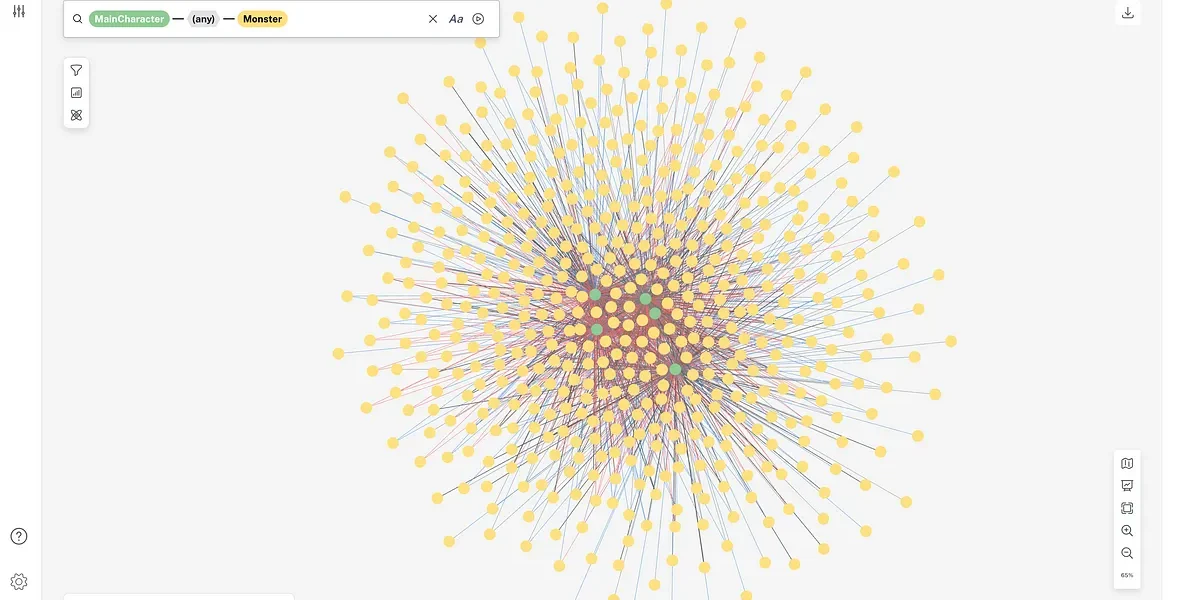
We think Neo4j Bloom is cool, even if in a way we’re competitors, because we see it as an enabler. People see the value of visualization, and while there are a lot of possibilities with Bloom and other tools, for some use cases, people realize that they need to have more.
That’s where we come in because we try to provide solutions that enable developers to realize their requirements, however complicated or specific those requirements may be. If developers have very specific requirements, and want to integrate visualization into their existing applications or create new applications, they can use our tools to create something that we haven’t even thought of before.
We see developers creating things that really are new to us, which is very exciting. We’re seeing so many opportunities and so many people doing different things with graphs. As you say, graphs are everywhere, and graphs want to be visualized.

What do you think is in store for the future of graphs?
Müller: The future of graph visualization is going to be exciting, because every day someone comes up with new ideas about how to visualize data and how to make it more easily accessible for end users.
We learn new things all the time because we follow the requirements of our customers, and we try to make it easy for them to realize all their requirements even before we know about them. It is really great for us to hear about their experiences.
When customers come to us and tell us what they implemented with our tools, it’s wonderful to see that they’ve built tools we never thought of before. We see that they manage to create new things with the help of our tools and with the data that they have in Neo4j.
Seeing things being created with our own tools is really rewarding for us, so that’s a great thing. The future is going to be bright. More data, more visualizations: I’m happy to see that.
Want to share about your Neo4j project in a future 5-Minute Interview? Drop us a line at content@neo4j.com
Download this white paper, How Google Kubernetes Engine & Neo4j Power Your Apps with Graphs, and discover the benefits of and use cases for adding Neo4j to your container architecture.Read the White Paper


