Visualizing this week in tech

Founder of Vecgraph
8 min read

Every week there seems to be an overwhelming amount of things happening in the tech world. New startups, products, funding rounds, acquisitions and scientific breakthroughs. All this results in a great deal of news content being produced.
TechCrunch publishes about 250 stories every week – for just one publication amongst many, that’s already a lot of information to take in.
Since I really love graphs and machine learning – even more so when they are combined – I thought it would be fascinating to visualize This Week in Tech stories in a graph, a way to visualize and explore the connections between the stories.
In this post, we’ll look at using machine learning and graph algorithms to explore a data visualization of clusters, connections and insights into what helped shape tech news this week.
Articles to knowledge graph
To make sense of all these articles, we can try to analyze and organize them in a process that produces additional insights.
Knowledge representation is a field in AI that focuses on representing information so that a computer program can access it autonomously for solving complex tasks. We represent the stories in a knowledge graph, which consists of a set of interconnected entities and their attributes. We’ll then create an ordered and connected version of the same information that’s otherwise isolated and disorganized.
To analyze the stories, we are going to make use of several AI and machine learning techniques.
The first technique is Named Entity Recognition (NER), to extract entities from the articles. Entities are things like people names, locations, organizations, startups, etc. The extracted entities allow us to recognize relations between stories by analyzing which content mentions the same or similar entities. IBM Watson also provides a relevance score that reflects how important an entity is to a text as well as the sentiment toward the entity.
To identify more complex connections that would require a better understanding of the world, we can make use of external knowledge bases. This helps our knowledge graph build a hierarchy of concepts that connects more stories.
For example, let’s say you find articles describing investments in two autonomous vehicle companies. NER can easily identify the two startups as companies, but it may not identify that these companies are related since they are in the same industry. Adding external knowledge can help make these connections.
Lastly, to capture some of the meaning of the text itself, we are going to make use of Doc2Vec embeddings.
The goal of Doc2Vec is to create a numeric representation of a document, regardless of its length. While the word “vectors” represents the concept of a word, the “document vector” intends to represent the concept of a document.
This vector is used for things like cosine similarity, where the similarity between two documents is measured. I’m not going to delve into too much detail about the theory behind Doc2Vec, but the original paper gives a great overview.
For this project, I used a Doc2Vec model trained a corpus of ~15,000 TechCrunch articles.
To get started, we are going to run one week’s (July 13 – July 20th) worth of TechCrunch stories (about 250) through the processing pipeline. This pipeline will first use IBM Watson’s Natural Language Understanding to extract the entities, concepts and topics from each story. We can then set up another API to process the raw text (tokenize and stem) and then use the TechCrunch Doc2Vec model to generate an embedding vector capturing the meaning of the story.
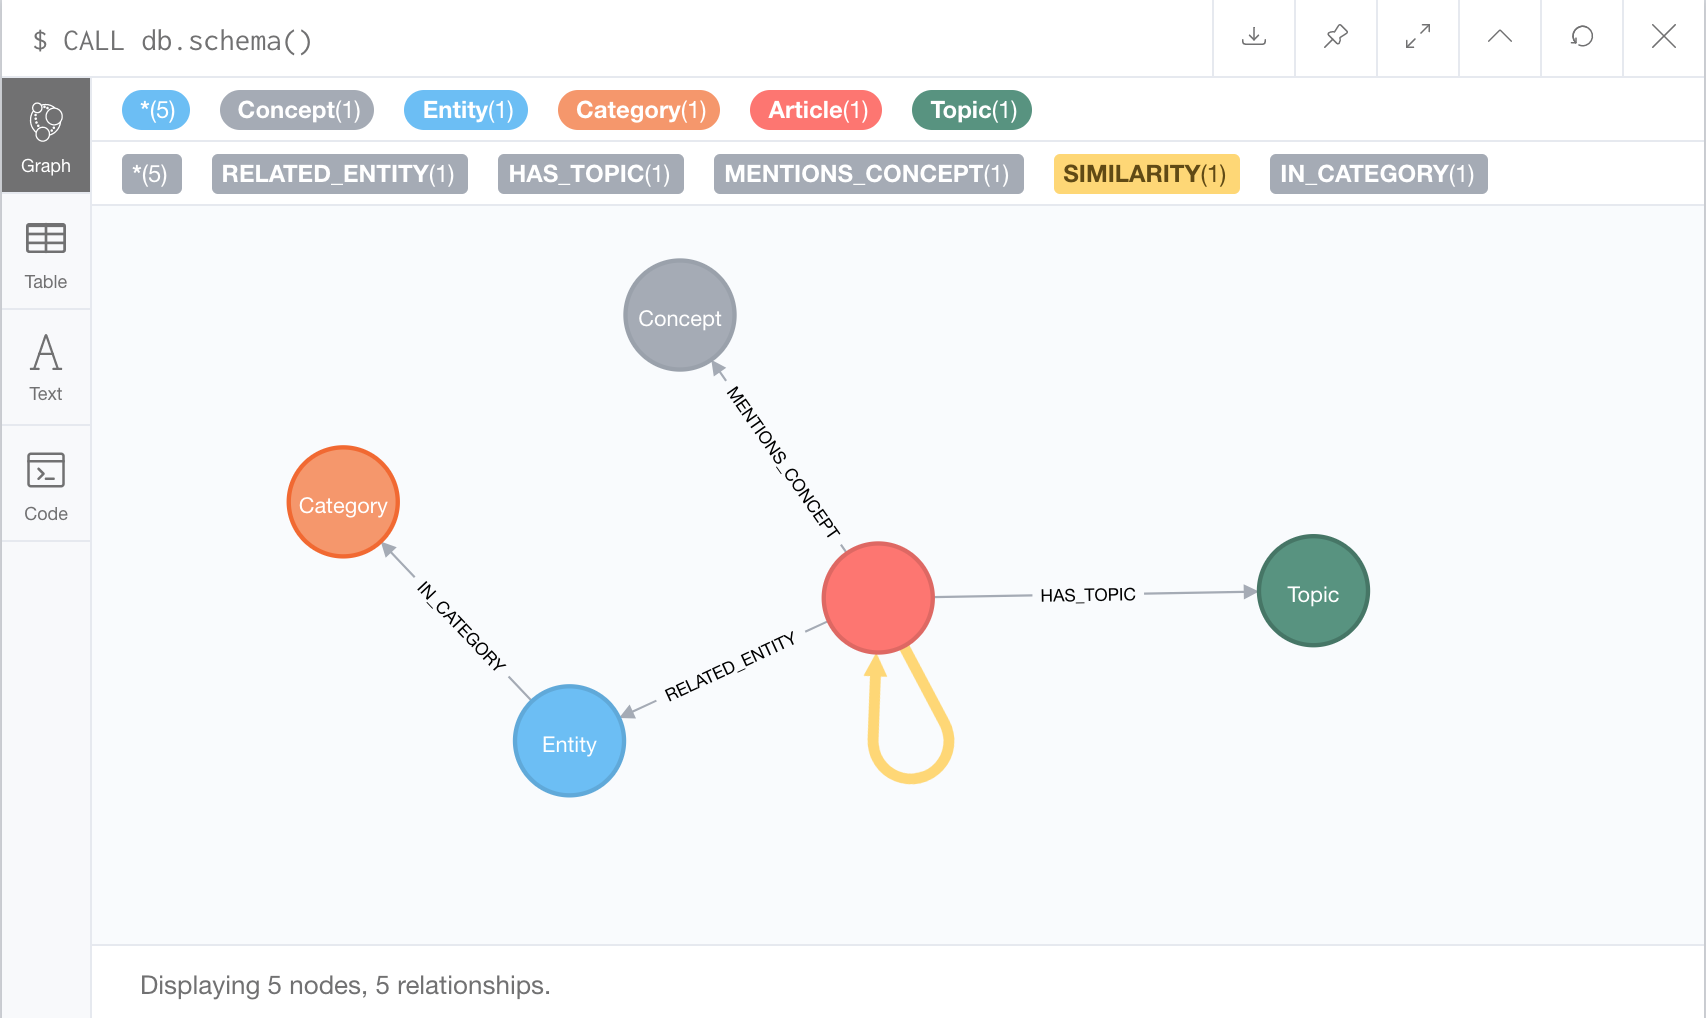
To manage all this information in the knowledge graph we can use the following graph model.
Each article node has an embedding property that stores the embedding vector (this will be important later). Each article node also has relationships to various concept, topic and entity nodes. Theses edges have a relevance and sentiment property.
Entity nodes can also have a relationship to a meta-category, such as companies or athletes. To visualize this model, we can use the built-in schema command.
To actually insert the articles we can use Py2neo to write a Python script that runs the following Cypher queries for the data on each article:
Creating article nodes:
MERGE (article:Article {url: {URL}})
ON CREATE SET article.title = {TITLE}, article.summary = {TEXT}, article.date = {DATE}, article.embedding = {EMBEDDING}
Related entities:
MATCH(article:Article {title:{TITLE}})

                MERGE (entity:Entity {label: {ENTITY_LABEL}})

                MERGE (article)-[r:RELATED_ENTITY]->(entity)
                SET r.type = {ENTITY_TYPE}
                SET r.count = {COUNT}
                SET r.score = {RELEVANCE}
                SET r.sentiment = {SENTIMENT}

                FOREACH (category IN {ENTITY_CATEGORIES} |
                    MERGE (cat:Category {label: category})
                    MERGE (entity)-[:IN_CATEGORY]->(cat)
                )
Here is a snippet of what analyzed articles in the knowledge graph look like:

The magic of weighted graphs
By adding a vector embedding property to each article node, we have created a very convenient way to measure the similarity between the two stories. This allows us to add a weight property to each relationship between two article nodes. This weight reflects how similar the two stories are.
Weighted graphs are incredibly useful for doing things like community detection, PageRank and finding shortest paths.
We can use the cosine similarity procedure from the Neo4j Graph Algorithms library to compute the weight between two articles nodes with the following query. Once again we’ll create a Python script that uses Py2neo to run the following query on each article node.
MATCH (a: Article{title:{TITLE}})
MATCH (b: Article)
WHERE NOT EXISTS((a)-[:SIMILARITY]->(b)) AND a <> b

WITH a, b, algo.similarity.cosine(a.embedding, b.embedding) as similarity

CREATE (a)-[r:SIMILARITY]->(b)
SET r.cosine_similarity = similarity
The results? A weighted graph where each edge between article nodes has a cosine_similarity property.

To get started with analyzing the weighted graph, we will once again use the Neo4j Graph Algorithms library to run the Louvain Community detection algorithm.
The algorithm is used for detecting communities in networks by maximizing modularity. Modularity is a metric that quantifies how well communities are assigned to nodes. It does this by evaluating how much more densely connected the nodes within a community are compared to how connected they would be in a random network.
The following snippet queries a subgraph using Cypher. This subgraph is composed of article nodes and their similarity relationships.
CALL algo.louvain(
                    'MATCH (p:Article) RETURN id(p) as id',
                    'MATCH (a1:Article)-[sim:SIMILARITY {most_related:true}]-(a2:Article)  RETURN id(a1) as source, id(a2) as target, sim.weight as weight',
                     {graph:'cypher', weightProperty: ‘cosine_similarity’, defaultValue: 0.0, write: true, writeProperty: louvain})
After running the algorithm, each article node will then have an integer as a property (“Louvain”), which specifies the community of articles it belongs to.
The Louvain graph algorithm performs very well. The visualization reveals various clusters for example security breaches, banking startups, and space exploration. You can check out the web app for a visualization of these clusters.
Result
To explore the weighted graph of stories I put together this web app. It uses React as well as Vis.js for the actual graph visualization.
Since each article node has an integer specifying its community, we can give each of these “topic clusters” a unique color.

You can click on any article node in the graph to explore it in more detail. The web app highlights the most related stories, and then displays in the sidebar. You can then use the slider to walk the graph traversing more related stories.

The cool part is that all these clusters were automatically determined using the techniques described earlier. You can see a large light blue cluster of articles related to space, or the yellow cluster of stories related to security.
Another interesting thing is exploring how two topic clusters are connected by a common story.
For example, the cluster of stories related to space exploration mentions a story about a rover used to explore a distant asteroid. This is related to a robotics cluster containing a story on an MIT robot mirroring a human, which in turn, is related to Elon Musk’s Neuralink developing human computer interfaces.
Conclusion
The techniques described here show how graphs can be used as a powerful tool for extracting insights from unstructured data. Neo4j’s Cypher and comprehensive graph libraries provide developers with amazing tools to implement some of these ideas.
Using some of these techniques to analyze this week’s tech stories resulted in a visualization of clusters, connections and insights into what helped shape This Week in Tech.
I’d love to hear what you thought of this project! I’m also always happy to discuss how you can use graphs to transform your data into actionable knowledge, create new services and reduce costs in your business.
Share Article


Explore
Related Articles


A workbench for teams to query, explore, and visualize graph data
Neo4j Named “One to Watch” in Snowflake’s 2026 Modern Marketing Data Stack Report

POLE+O: The 5-Type Ontology That Solves the Hardest Part of Building a Knowledge Graph
