What’s new with Graph Data Science: GDS 1.7 release

Senior Director of Product Management, Graph Data Science
5 min read
At this point, we’re all back from our summer holidays – whether we want to be or not. One consolation prize, though, is that the team at Neo4j spent our summer putting together another fabulous update to the Graph Data Science Library! ?
This release was really focused on making graph data science accessible, easy, and foolproof. We listened to your feedback and focused our efforts on making sure you all were able to focus on finding value with graphs – new insights, predictions – while we do the heavy lifting behind the scenes. In 1.7, we focused on our infrastructure, MLOps capabilities to ensure you get to production fast, and delivering some killer features you’ve been asking for.
Make it super simple
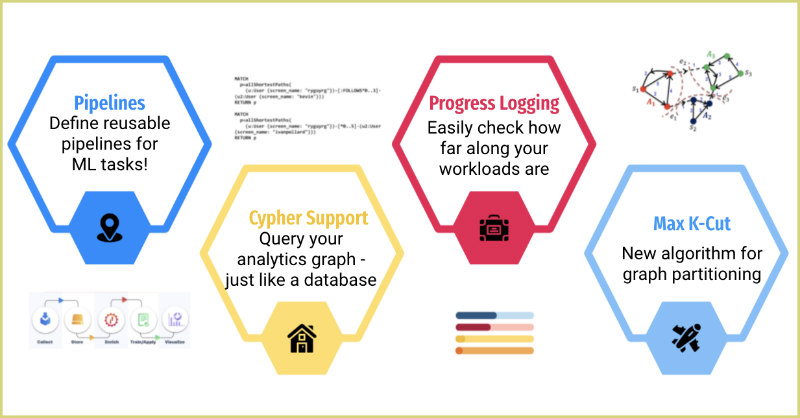
Our job is to deal with data manipulation and math so you can focus on value. We introduced Link Prediction a few releases back to make it possible for our users to train supervised machine learning models inside Neo4j, to fill in missing relationships, or predict ones that would form in the future. Link prediction is really valuable, but we heard you when you said it was hard! This release, we made things easier for you, by adding the ability to define link prediction pipelines.
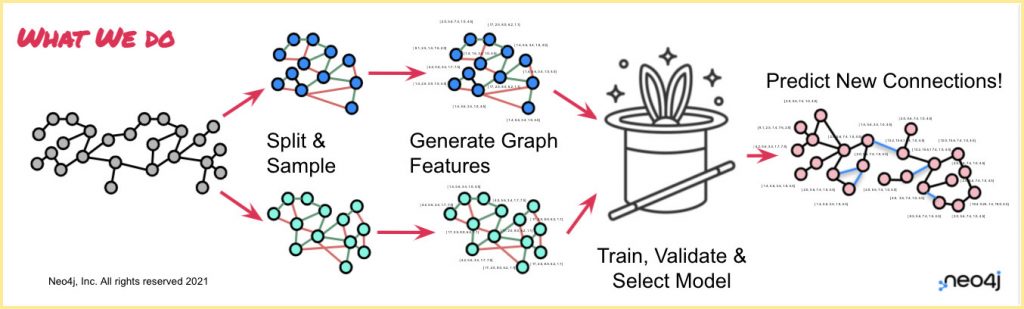
You’re probably already familiar with the concept of pipelines from scikitlearn, MLLib, or maybe the “pipeliner” or “recipes” packages in R. Essentially, a pipeline lets you define all the steps you want to take to build your predictive model, assembles them into a workflow, and then lets you apply those defined steps to data to train your best model, then apply that winning model to new data.
Now, Neo4j’s GDS 1.7 release introduces machine learning pipelines for graph native link prediction. You don’t have to worry about making sure you’ve got the right features in your input data when you’re trying to make new predictions, or whether or not you got the steps right with splitting and generating your features to avoid data leakage. You tell us what you want to do, we figure out how to do it.

From a practical perspective, this means you can create a pipeline and define the node and link features you want to use, how you want to split the data, and how you want us to select the best performing model… and we do the rest! Internally, we assemble those steps in the right order, so you can train (and re-train!) your predictive model, or make predictions on a new graph.
With our new link prediction pipelines, it’s easier than ever before to go from raw data to a highly predictive model – with confidence that you haven’t accidentally mis-sampled your edges, corrupted your data, or leaked information – all inside Neo4j!
Production shouldn’t be a problem
We introduced link prediction pipelines to make model building easier and less error prone – we added progress logging and system monitoring to make it easier to monitor the status of your workloads and the utilization of your instances when you have teams collaborating on common data.
Our new progress logging procedures let you quickly check on your long running jobs – and be able to see how far along they are, and how long they’ve been running. This means you won’t be sitting around wondering how long betweenness centrality is going to take, or exactly how far along graphSAGE is in training a GNN.
System monitoring is a new enterprise feature that takes that observability to the next level: a simple command to reveal your team’s utilization of resources on a shared system. Not only can you see ongoing procedures and their progress, but you can quickly check the amount of available memory and threads. This means that – instead of wondering if your job is stuck because your coworker is hogging resources – you can understand the system load before kicking off a long running job.
Keep delivering on your requests
We love hearing from our community, and your requests help us build better products. For this release, we’ve added three new features you’ve been requesting since the beginning:
- Cypher on the GDS Graph: Folks have wanted to interact with their graph projections – what GDS works with – just like they would with their underlying neo4j database. Now they can! As of GDS 1.7, you can query your graph projection with Cypher!
- String Support for Graph Export (both for exporting CSVs and creating new databases): Users love being able to dump their graph projections – and results – to new databases or CSV files, but from the beginning it’s been a problem that you can’t include string properties. Now you can! You just need to specify which additional database properties you want exported, and they’ll be available in the export files.
- Graph Partitioning: We try to sneak in a new algorithm every release, and this time around, it’s Approximate Maximum K-Cut. A K-cut is an assignment of nodes in a graph into k-disjoint communities. The idea is that you want to maximize the number of relationships across communities – the opposite of a typical community detection algorithm! Max K cut has applications in physics, statistics, circuit design, and more.
Tell us what you think!
As always, we want to hear from you – what do you like in the release, what can we improve, and what are you keen to see next! The best place to ask questions is in the Neo4j Community Forum, and requests or bug reports can be directed to our GitHub.
Share Article


Explore
Related Articles
Neo4j Named “One to Watch” in Snowflake’s 2026 Modern Marketing Data Stack Report
New research finds enterprises earn 230% ROI with Neo4j Graph Intelligence Platform

SumoDB in Neo4j: Chaining Multiple Graph Algorithms in Snowflake — Part 3

