Leveraging the Graph for Clinical Trials and Standards
Global healthcare company Novo Nordisk uses Neo4j as the backbone of an application that streamlines the process of collecting and reporting clinical studies data.
In the world of pharmaceuticals, rigorous testing must take place before new drugs and treatments advance out of the laboratory. But before a new drug gets to market—this goes for Novo Nordisk and all other pharma firms—they must prove the drug is effective against the disease and that it’s safe to use.
Enter clinical trials and their many phases. Putting a new treatment through clinical trial is rigorous and time consuming; the trial must be documented every step of the way using universally accepted controlled terminology for the values and items within datasets. This gets even more complicated when the trial is global, with data being collected in different languages, units of measure, and more.
By the numbers: Novo Nordisk
- Nodes: One Million
- Relationships: Two Million +
- Platform: Neo4j Enterprise
The global pharmaceutical community has a set of accepted standards for clinical trial submissions, which requires the study planners to submit highly detailed documentation for how the study will be performed.
“It’s basically a Word document and it contains very detailed information: What visits will the patients come to? What will happen during each visit? Exactly what treatment they will get? What measurements will be taken, and what will be reported in what data format, et cetera. In parallel with this all the reporting forms, instructions, et cetera, that the trial sites need for receiving the patients is being prepared,” said Henrik Enquist, Advanced IT Developer at Novo Nordisk. “This is really time consuming.”
It’s also highly error prone because of how disconnected everything is. One update to one part of the process triggers a cascade of subsequent updates on documents elsewhere. Even if no mistakes are made, the whole process of manually updating the documentation takes a lot of valuable time.
“Just setting up the trial takes so much more time than it could,” Enquist said.
The Solution Is a Knowledge Graph
Novo Nordisk’s solution to this problem is an application it calls StudyBuilder.
With Neo4j at its core, StudyBuilder acts as a hub for all the information that must be collected for a clinical trial. The application functions as a library for data points that are shared between studies, and as a catalog for describing the details of the study.
StudyBuilder applies a new approach to handling study specifications that:
- Ensures a higher degree of end-to-end consistency
- Enables built-in compliance with external and internal standards
- Facilitates more automation and content reuse
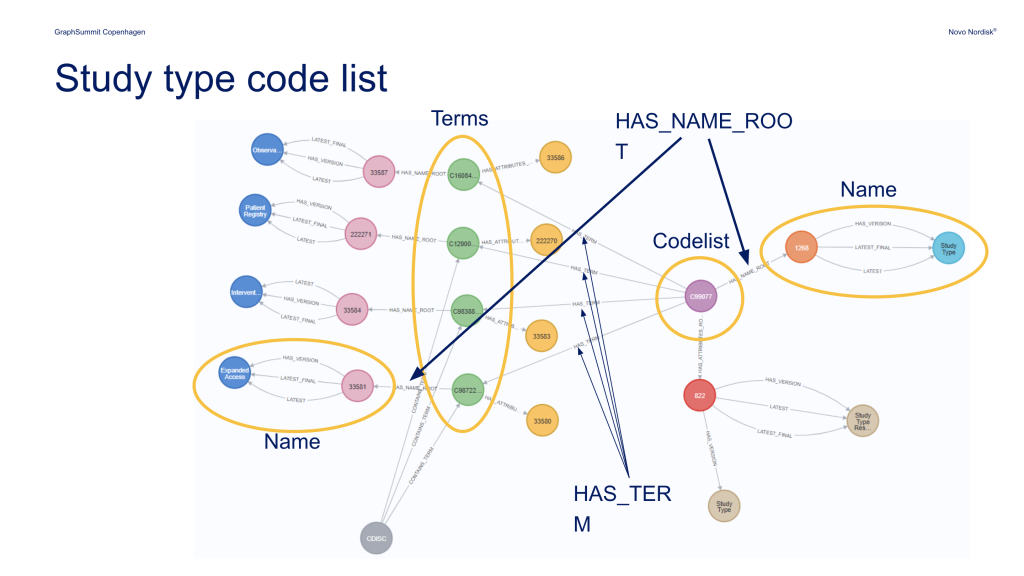
“StudyBuilder relies on using clinical standards,” Enquist said. “An important part of this is to use control terminology when we describe things. So if I talk about a measurement, say blood pressure, we must make sure that all the sites are describing this blood pressure measurement in the same way, using the same words so we can actually map things together at the end.”
Blood pressure measurements and myriad other processes and data points are described using a set terminology standardized across all clinical studies.
Novo Nordisk chose to build StudyBuilder on top of a Neo4j knowledge graph because of its strong performance when navigating a landscape of highly connected data standards, including CDISC, SNOWMED, UCUM, and more.
Putting the Graph to the Test
StudyBuilder is still relatively new at Novo Nordisk, and it has not yet been fully deployed. The old manual system is still partially in use, at least for now. This existing solution contains more than 300 tables used to keep track of the various standards used in Novo Nordisk’s clinical trials. Three hundred will soon become 400 or 500, Enquist said. “It’s growing at a pace that’s not very comfortable.”
“But hopefully, before that happens, we will replace the whole thing with a StudyBuilder and we won’t have this problem anymore,” he said.
With so many tables in play, using a graph to make sense of it all is a natural choice.
“Graphs are really good at capturing these complex relationships between the different things,” Enquist said. “So from a syntax template where we have something that can be a compound and a compound is administered in doses … it connects to all these things sideways between different tables. The graph database fits quite well with the data that we have.”
An Open Source Future Where Every Clinical Trial Is a Graph
With StudyBuilder live, Novo Nordisk now has a foundation for digitalisation and a future master data foundation for all its clinical studies, from setup to submission.
And all the work that’s has gone into creating this system is being shared with the pharmaceutical community.
“And the really nice thing is that we will release this as an open source project. We’re not quite there yet, but it will come during this fall,” Enquist said. “And the hope, of course, is that it won’t be used only at Novo Nordisk, but it’ll become a standard that many pharma companies use and actually will contribute to. We’ll see how that goes. But we have high hopes for this part.”

Explore More