The 22 Millisecond Store: Exploring Real-Time Retail with Tchibo & Neo4j
Germany's Tchibo changes its entire inventory every week. Tchibo wants each visitor to see a store tailored uniquely for them, instantly.
22 milliseconds
query response time for real-time analytics across complex user behavior patterns
71%
of consumers now expect personalized interactions
9+ million
monthly webshop visitors could receive personalized experiences through graph-powered analytics
Once a week, Tchibo rewrites its own store.
The 75-year-old German retail giant generates €3.36 billion annually through a revolutionary business model: “Every week is a new world.” One hundred new products launch each week across 8,000 retail outlets, its 900 own shops, and its online platform, replacing items for sale spanning clothing, furniture, household items, and electronics.
This dynamic inventory model creates an extraordinary technical challenge. With an entire product catalog shifting every seven days, customer behavior data from yesterday is already out of date. Traditional retailers rely on stable product catalogs and predictable customer journeys; Tchibo must understand and respond to customer behavior in real-time as products appear and disappear.
Decades of weekly reinvention taught Tchibo that momentum sells and well-timed suggestions turn browsers into buyers. But in an online marketplace where anyone can buy anything at any time, failing to immediately convert means vanishing from view. Even a few seconds of delay in personalizing the experience or answering a business question can cost a sale. The tracking team at Tchibo decided to build a system that could capture complex user behavior at the speed of a click.
According to PwC research on customer data ROI, retailers using real-time customer insights can increase overall margins by 10-20%. In an era where tech-native retail giants compete on algorithmic precision, that margin advantage is the difference between surviving and thriving. But a McKinsey report on personalization points to a gap: while 71% of consumers now expect personalized interactions, 76% become frustrated when companies fail to deliver them. That’s three out of four customers walking away disappointed — a margin-crushing reality for any retailer.
“We have terabytes of data, but we need to bring more value out of this,” explains Maryna Zhygadlo, Technical Lead of Tracking at Tchibo. “The standard approach with flat data structures and scheduled data loads gave us delayed insights.”
“Tomorrow Is Too Late”: Why Weekly Reinvention Demands Split-Second Intelligence
Most retailers can wait hours or days for customer insights, but Tchibo’s weekly product rotation meant that by the time traditional batch processing delivered answers, the entire inventory had changed.
ETL batch-based pipelines made it difficult to keep up with the speed of digital commerce and the demands of real-time online sales. Urgent questions like “How many people are browsing coffee subscriptions right now?” couldn’t be answered in the moment. In Tchibo’s world, a lost moment often meant a lost customer.
Technical barriers ran deep. Relational databases excel at batch aggregation but struggle with millisecond-scale queries over complex, constantly shifting connections. Reconstructing a customer’s journey across multiple touchpoints like homepage visits, themed pages, and product views required expensive joins across tables. SQL queries couldn’t deliver the sub-second responses needed for real-time personalization.
The breakthrough came unexpectedly. During an internal hackathon, flat table tracking data was combined with AI capabilities, but the results didn’t meet expectations. Shortly afterward, Zhygadlo was introduced to Neo4j at a workshop.
Where traditional databases saw isolated events, Neo4j saw connected stories. Where SQL required complex joins to reconstruct customer paths, graph queries traversed relationships naturally. The technology matched the problem: dynamic, interconnected, and built for speed. This was because Neo4j stored connections as first-class citizens, making it possible to traverse millions of relationships in milliseconds and transform data into knowledge.
“A web application is a perfect tree,” Zhygadlo realized. “Nodes and leaves, branches as transitions. It’s the natural structure users move through.”
Suddenly, everything clicked. Each page view became a node. Each click became a relationship. Abandoned carts were patterns waiting to be understood. The coffee subscription journey could be visualized as a network of possibilities, with each path revealing something crucial about customer intent. “We intentionally limited our focus to the coffee subscription journey, as it offered a clear, high-impact use case,” Zhygadlo shares.
Michael Bauer, Senior Technical Digital Analyst at Tchibo, brought this perspective to life — recognizing that mapping user interactions as a graph could unlock deeper insights into customer behavior and intent.
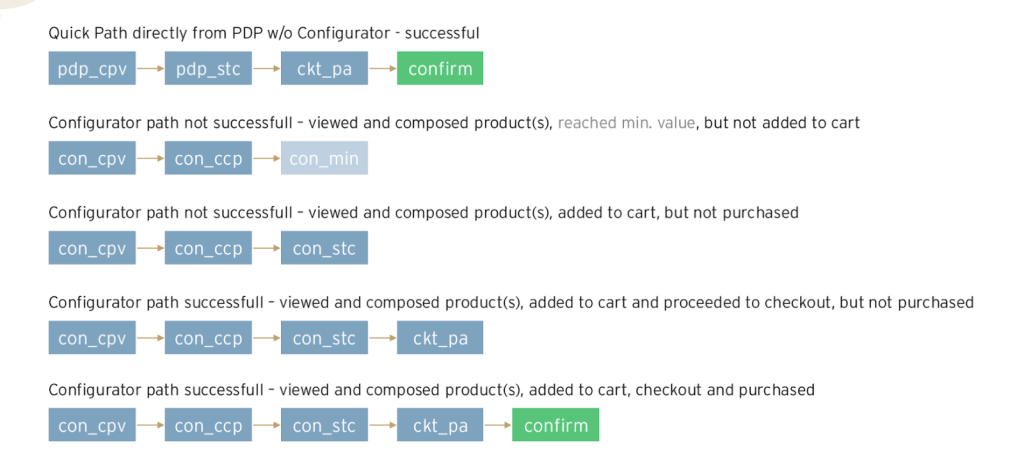
Above: Examples of Tchibo user paths, visualized sequentially as nodes and hops
For Tchibo, that would mean finally being able to answer high-value, time-sensitive questions:
- Which journeys convert fastest for this week’s top product?
- How many customers are currently in the coffee subscription configurator?
- Which drop-off patterns predict churn risk?
Working within a one-month POC timeline, Tchibo built a hybrid ingestion model that combined nine months of historical data with real-time updates. Using their Google Cloud Platform infrastructure, they created a Kotlin-based REST API with Neo4j adapters. Steffen Hespe, Full Stack Developer at Tchibo, developed the real-time graph update logic, enabling the system to build and update the graph dynamically as users clicked through the platform.
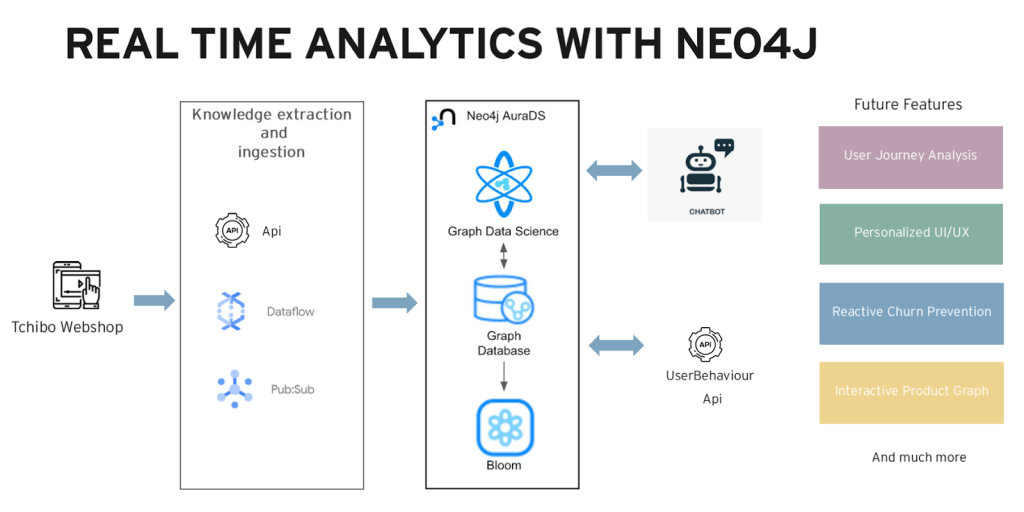
Above: Tchibo’s analytics architecture, powered by Neo4j
The architecture balanced simplicity with power:
- JavaScript tracking calls REST API, which updates Neo4j graph in real-time
- User behavior API connects front-end to Neo4j for instant insights
- Vertex AI with LangChain translates natural language questions to Cypher queries
- Neo4j Bloom provides visual exploration of user patterns
“We could watch it happening,” Zhygadlo remembers. “The graph updating in real-time through Bloom. Patterns emerging, showing the most popular paths to purchase.”
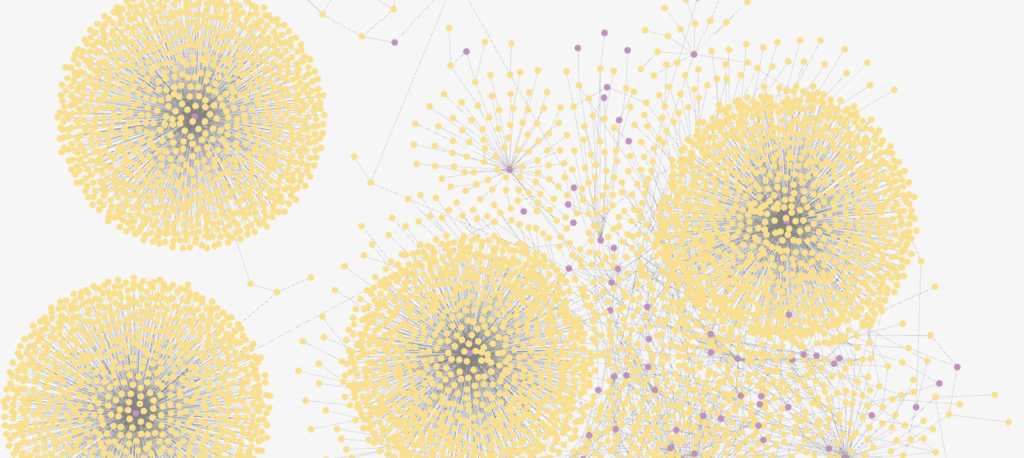
Above: Tchibo’s graph data model in Bloom
22 Milliseconds to Insight: The Speed of Modern Retail
The results exceeded expectations. Three million nodes. 2.8 million relationships tracking user behavior. Neo4j delivered query responses to user interface in 22 milliseconds, faster than Tchibo’s batch process, turning next-day reports into instant answers.
“Latency was our success metric,” Zhygadlo emphasizes. “Twenty-two milliseconds. Really, really good.”
Speed was transformative. And opening the data to everyone changed the game. Marketing teams and business analysts no longer waited for scheduled reports or begged the data team for custom queries. The Generative AI-powered agent let them ask questions in plain language, such as “How many users bought coffee subscriptions in the last five minutes?” “What percentage of journeys to subscription were successful?” or “What’s the shortest path to purchase for this week’s products?”
The system translates each query into Cypher and returns results instantly.
“We connected Neo4 directly to Vertex AI with LangChain so marketing could ask questions in plain language. In retail, timing is everything. If you know demand in the moment, you can act in the moment, whether that’s adjusting pricing, triggering a promotion, or moving stock. That’s where Neo4j GraphRAG and Google Cloud make the difference.”
Creating Real-Time Social Proof
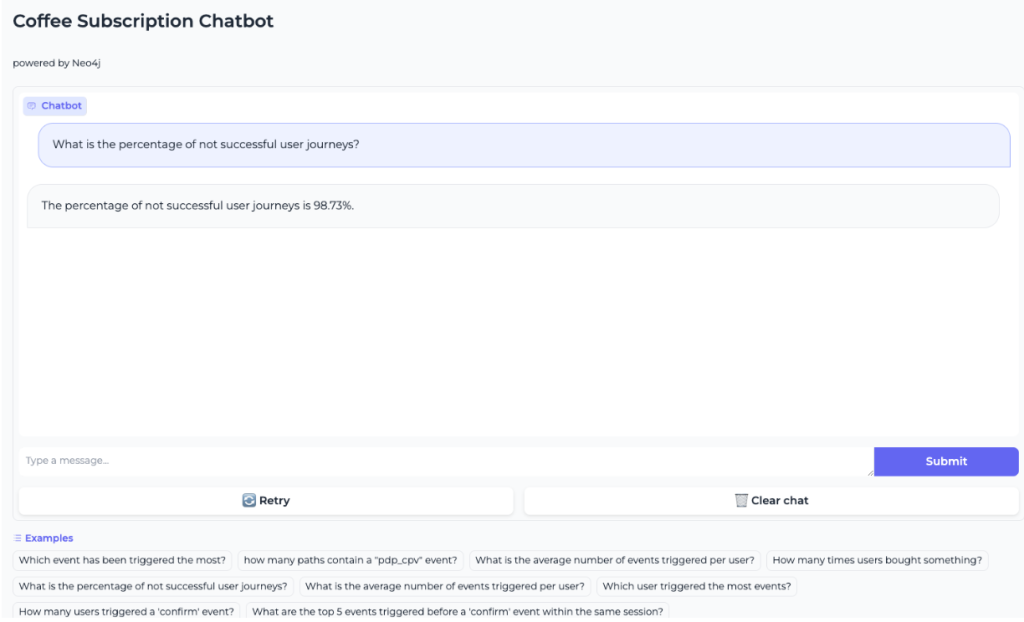
Above: Tchibo’s coffee subscription chatbot
The team showcased the power of real-time graph analytics with a coffee subscription configurator. It showed how many other customers were viewing the same subscription plan. This wasn’t a pre-calculated figure but one computed live from the last five or ten minutes of activity. For a retailer, that immediacy turns passive browsing into social proof and urgency, nudging faster purchases and boosting conversion rates in the moment.
“We could understand demand as it happens,” Zhygadlo notes. “Graph technology gave us this capability.”
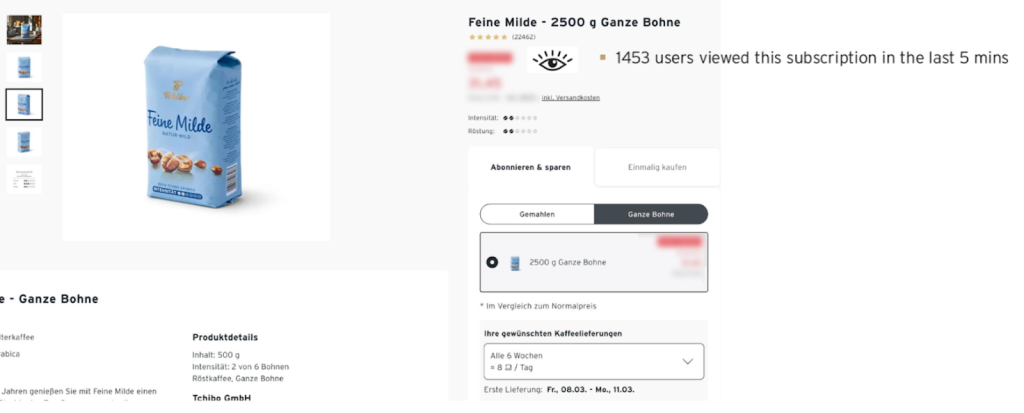
Above: A live count of users browsing products creates social proof and urgency
Expanding the Vision
Success drew attention across the business. The offline team wanted to link in-store tracking with online behavior, making true omnichannel analytics possible. The product management team asked for tools to segment products and detect fraud patterns.
“The secret lies in how you build the graph and what you want to achieve,” Zhygadlo reflects. “We can extend beyond user behavior data. We can include data from offline shops. Show specific products or UI elements in the web shop. Create that bidirectional flow.”
The vision extends further. Every page interaction becomes a node in the customer graph model. Tchibo could dynamically reconfigure itself in real-time to match behavior patterns. Analysts could predict churn probability from failed journeys, marketers intervene with targeted retention strategies before customers walk away.
“We’re no longer spending our time just collecting data,” Zhygadlo says. “We’re building insights that bring value the moment they’re needed. Graph technology makes this possible. We understand relationships at the speed of Tchibo.”
-
 Google Cloud Platform
Explore More