Analyzing Annual Reports Using LLMs and Graph Technology

Customer Success Manager
7 min read

Natural language processing made easy
TL;DR — The approach is different, easier, and better. The results can be expanded with ease.
Back in 2019, I led the development of an experiential graph platform. We explored various areas where Graph modeling could offer potential value, including solution composition, idea/POC similarity, and, finally, text analytics for large documents such as annual reports. The NLP analysis leveraged the Azure Cognitive Services API, and the team developed an impressive solution, complete with analytical features such as key topics and trends across a collection of papers, along with the ability to match the results with potential solutions within the other module of the platform. I documented the main approach here.
That was then. This is now.
With the availability of LLMs and their ability to not only analyze unstructured text but also generate the required code to insert the results into a Graph database, can I, someone who doesn’t really code anymore, recreate the NLP solution I sketched on a whiteboard and my team implemented back in 2019?
Firstly, credit to Kristof Neys, who shared an excellent Colab notebook as the foundation for this; his notebook reads and creates a Graph database from patient medical notes. The notebook handled all the backend steps required for my review and allowed me to focus on the business challenge I had in mind. Without Kristof’s notebook, I would not have been able to get started.
And that’s the point. We’ve been discussing the “democratization of data” for years, and this is the first time I feel it’s truly the case. I’ve been able to look at the problem and apply my skills without losing too much time on the complexity of the enabling technology.
A good friend and coach, Dr. Peter Beijer, introduced me to the principles of solution architecture in the early 2000s, just as I was transitioning from a Software Engineer to a Solution Architect. The guidance he provided transformed my career, and one key area that I apply almost every day is the principle that a solution can be broken down into four layers: Business, Functional, Technical, and Implementation. In my career as a Solution Architect and now within Customer Success, it’s the first two layers where I excel, with the added benefit of being able to understand and dabble in the technical layer. Please don’t ask me to implement a highly scalable and performant cloud architecture.
Getting Things Moving
There was some technical preparation required, but nothing more painful than setting up the OpenAI API key and provisioning a Neo4j Aura DB instance. With these in hand I was able to first validate I could follow Kristof’s notebook and create a sample database.
My Areas of Focus.
I wanted to ground my challenge to something of value. Within sales and success, the key is to understand how the solution will meet the customer’s needs and goals. But where can we learn about what these are? Often, the most reliable source for this information is the annual reports and strategy papers that organizations publish.
But, it’s essential to recognize that the LLM (Large Language Model) won’t generate meaningful insights from thin air; there must be a logical approach to tackling the challenge. First, you need to understand the content within these documents and define your objectives. Annual reports contain a wealth of data, but what specific information are you looking to extract? Is it financial statements, merger and acquisition details, market trends, industry directions, legal aspects, risks, or external factors? The potential for insights is vast from this single asset, so it’s crucial to clearly define what the LLM should be searching for.
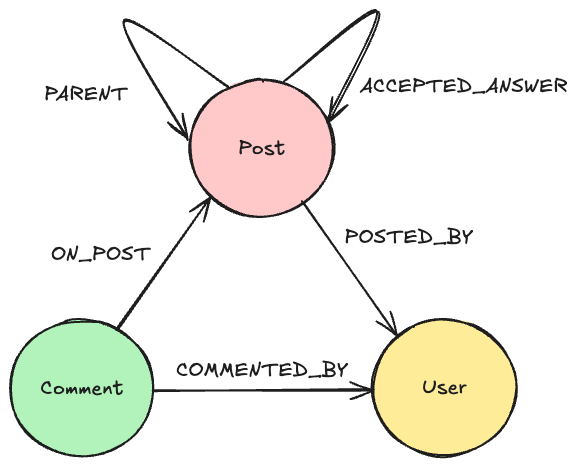
Secondly, the next step is to design your graph model. Once you’ve gained an understanding of what you want to extract from the document, you can begin crafting an initial graph model. My initial model was fairly simple…

Prompts
This is where things get interesting and different from the 2019 approach. In 2019, we let the NLP API do all the work. We passed it a block of text and took the entities and categories as the result. With the LLM approach, I could give a more detailed breakdown of what I was interested in. I began to frame the problem using prompts. These prompts were tailored to the business context and didn’t require explaining the document’s detailed structure. Instead, they outlined what the model should focus on, like business trends, technology trends, and key individuals. This shift meant I could efficiently extract valuable insights without delving into the document’s complexities, making the process more agile and aligned with our specific business goals.
Here are some of the example label definitions:
label:'TechnologyTrend' name:string,name:string //any known technology term within the text,summary:string //Summary of the trend as defined by openAI;'name' property is the name of the technology trend, in lowercase & camel-case & should always start with an alphabet; summary is a description as defined within openai
label:'Risk' name:string,summary:string //any known factor which might present a risk to the organisation, summary:string //Summary of the trend as defined by openAI;'name' property is the name of the risk, in lowercase & camel-case & should always start with an alphabet; summary is a description as defined within openai
Each label or node to be created within the graph is described with its name and required property values, plus details on what the LLM should consider to identify these values. I also added a summary property to store the general description defined within the OpenAI LLM.
The relationships are described in a similar way. Here, I also included a counter value to record the number of times a certain entity is mentioned within the text.
paper|MENTIONS_BUSINESSTREND{countof:sting}|businesstrend //the properties inside MENTIONS_BUSINESSTREND gets populated from the text and is a count of the number of times the trend is mentioned
The Results
For my initial results, I decided to include only the entities that corresponded to the scope of the 2019 project, known business and technology trends. In terms of the data that was generated, the results were very similar to what had been achieved in 2019. However, there was one notable advantage — I could rapidly iterate on the data model by making simple revisions to the prompts.
This ability to refine the model swiftly through prompt revision is a game-changer. It allows for a more dynamic and responsive approach to fine-tuning the output, enabling me to adapt and improve the results with remarkable speed. This iterative process not only maintained the scope of the 2019 project but also introduced newfound flexibility and efficiency in data extraction.
There is a risk, of course, to limit the results to only entities or categories to which I have prior knowledge. This was addressed by adding a “catch all” label within my prompt definitions.
label:'EoI' id:string,name:string, summary:string //any other entity within the text which is of potential interest //Summary is the general description of the entity as defined within OpenAI


The final data model I developed significantly exceeded my initial sketch. It resulted in a more comprehensive set of entities that can be thoroughly analyzed across a collection of annual reports. The evolution of the data model allowed for a deeper and more nuanced understanding of the information contained in these reports, thereby enhancing the quality and depth of the insights that can be derived from the data.


Taking This Into Production
The notebook and prototyping above validate the high value of using the LLM to extract key entities and create the knowledge graph. To take such an approach into production, we would need to apply the same methods we adopted in 2019.
Chunking:
The Azure NLP API had a defined limit on the length of text it would process within a single call, and the same applies to the LLM API. The API has a set limit of 7,500 characters, so consideration should be given to where the text is split to ensure that no context is lost due to splitting the text in the middle of a sentence.
API Costs:
Each call to the API will incur a cost. To address this in 2019, we collected and stored an MD5 value for each text chunk and only sent new chunks to the API. For matching text chunks, we retrieved the existing graph. This approach could also be applied here, with the option to force the API call, allowing for updates to the prompt definitions to be applied and taking advantage of updates within the LLM itself.
Something New
I can envision a potential lightweight, general-purpose application enabling a user to describe their document and then drag and drop a set of PDF documents. These documents would be broken down and analyzed by the LLM, and the results would be presented as a graph visualization. But that is for someone who can actually code.
A copy of the notebook is available here
References
Knowledge Graphs & LLMs: Harnessing Large Language Models with Neo4j (Oskar Hane)
Analyzing Annual Reports Using LLMs and Graph Technology was originally published in Neo4j Developer Blog on Medium, where people are continuing the conversation by highlighting and responding to this story.


