Real-time dashboard of Bitcoin transactions with Neo4j and NeoDash

Graph ML and GenAI Research, Neo4j
10 min read
Cryptocurrencies have become more and more integrated into our daily life. Many cryptocurrencies like Bitcoin and Ethereum are decentralized networks based on blockchain technology. They have a wide array of use-cases and have been implemented by various companies and governments. One remarkable attribute of many cryptocurrencies is that all the transactions are available publicly.
In addition, some sites offer freely accessible endpoints to retrieve crypto transactions in real time. That makes developing a monitoring tool to analyze the crypto transactions or track how value flows throughout the network incredibly easy.
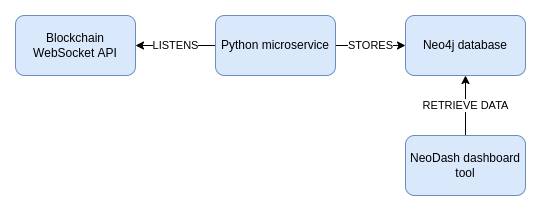
This post will present a simple architecture to listen, store, and analyze Bitcoin transactions in real-time. We will be using the Blockchain.com WebSocket API to listen for new Bitcoin transactions. It is a free endpoint and does not require any authorization.
Most transactions can be represented as an exchange of value between two or more entities. If you are like me, the first thing you think about when you hear someone presenting a data format that contains entities and their relationships, is a graph. Therefore, it makes sense to store Bitcoin transactions in a graph database. Not only are you able to calculate various data statistics, but more importantly, you can analyze the flow of value within the network and more easily identify significant actors.
In this example, we will be using Neo4j, a native graph database, to store the retrieved information. Lastly, we will be using a simple dashboard tool called NeoDash, that you can connect to Neo4j and seamlessly develop various visualizations for more straightforward data analysis.
Before we begin with the code, we first have to review the structure of Bitcoin transactions. For example, you might be used to dealing with transactions having a single sender and recipient. However, this is not the case with Bitcoin. Instead, any Bitcoin transaction can have multiple senders and recipients.
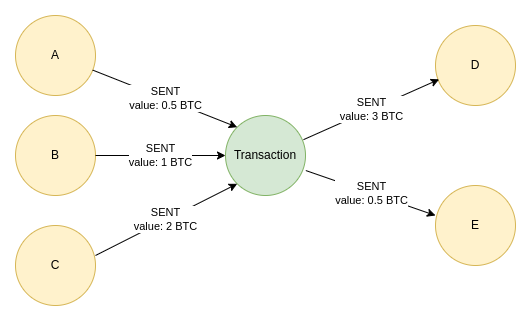
In Bitcoin terminology, the senders are called inputs, while the recipients are called outputs. Since a single transaction can have multiple inputs and outputs, we model the transaction as an intermediate node. This model allows us to capture the transactions in the original form as we can append multiple incoming and outgoing links to a transaction node.
I’ve also learned another intriguing characteristic of the Bitcoin network.
For example, let’s say that person A and B sent you each 0.5 BTC. So now you own 1 BTC in total that came from two separate transactions. You’ve got a good friend Jimmy, and you want to send him 0.8 BTC. The transaction data structure will the following:
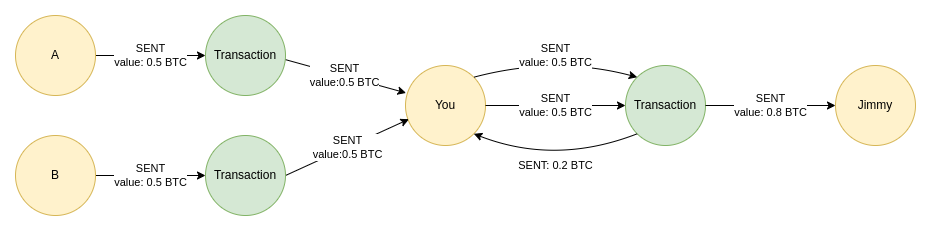
So first, you can only send what you received from other transactions as input. It can’t be more or less. I didn’t know this before, but Håkan Löfqvist explained it with a simple example. Every BTC you receive from a transaction is like a dollar note. The only difference is that the value of a note could be any number of BTCs. You first received two bills in the above examples, each worth 0.5 BTC. Now you want to pay 0.8 BTC for a ticket to a movie theater.
The cashier will take both of your notes and return you the 0.2 BTC change. I guess this data structure guarantees the integrity of the whole blockchain, but I haven’t delved much into it. Anyhow, the transaction will appear to have a total value of 1 BTC, even though the 0.2 BTC was returned as change. I’ve introduced another term in my graph model to deal with this. Even though the total value of the transaction is 1 BTC, the value flow is only 0.8 BTC. By the transaction value flow, I will be referring to the worth of BTC that wasn’t returned as “change”.
Here is an example of a Bitcoin transaction with a total value of 1.2 billion USD, but the actual flow value is only 50 USD. As most of the value was returned to the original sender, it is not insightful information when analyzing Bitcoin network flows. However, it’s still interesting to know that someone has a single BTC note worth more than a billion dollars.
The real-time dashboard code is available as a GitHub repository.
Developing a real-time Bitcoin dashboard
Now that we got the theory out of the way, we can delve into developing a real-time Bitcoin dashboard. We will begin by defining the Neo4j graph model. We have two options for modeling Bitcoin transactions.
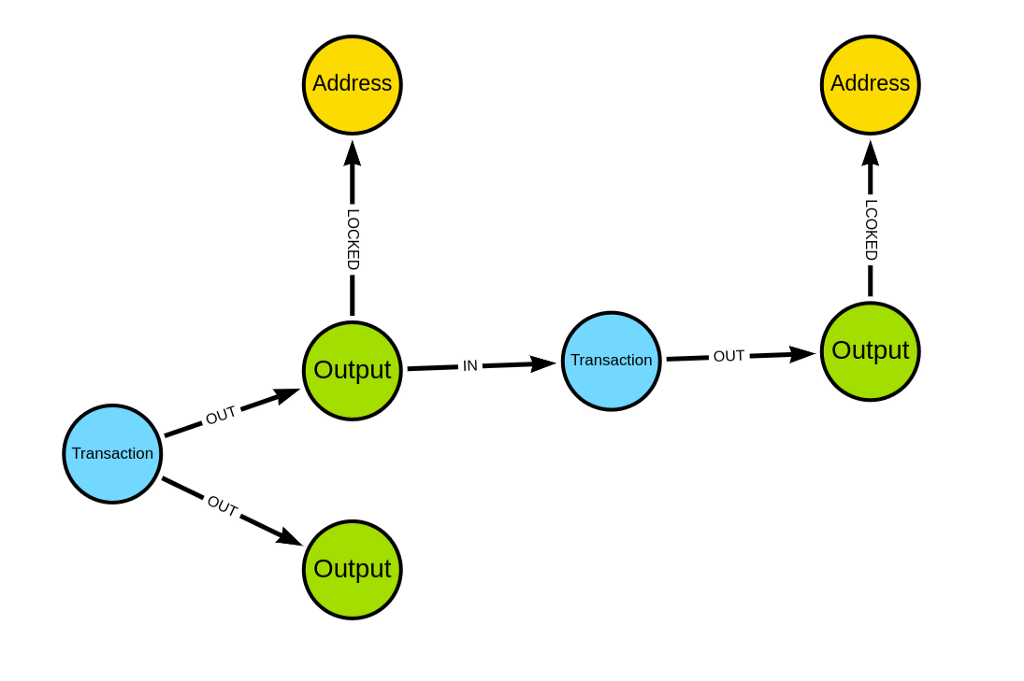
Modeling transaction outputs as explicit nodes is an option. With this approach, we preserve the original structure of the Bitcoin blockchain and its information. It allows us to quickly retrieve how many Bitcoin notes (outputs) each address has and how many of them have been spent. The address is the ID of where the Bitcoins are being held.
However, I’ve decided to use a simpler graph model as I was only interested in analyzing the flow of Bitcoin transactions through the network and less about how many spent or unspent outputs each address has.
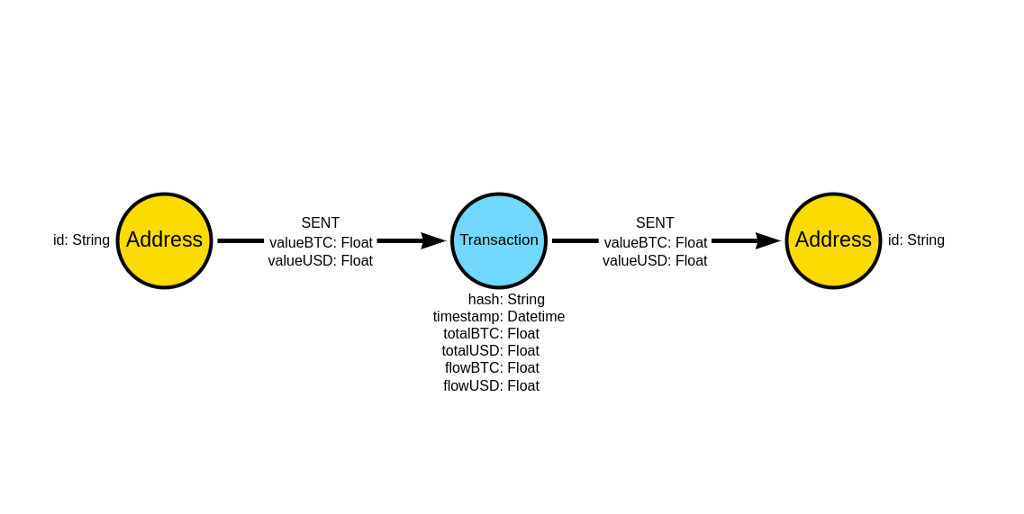
The graph consists of addresses and transactions. The transaction nodes contain the transaction hash and the timestamp and some preprocessed information like the total and the flow value of the transaction. The original input and output contributions are stored as relationship properties to allow multiple inputs and outputs with various contributions.
The direction of the relationships indicates the flow of value.
The GitHub repository contains the define_schema.sh bash scripts that sets up unique constraints and indexes in Neo4j.
We will take a look at the Python microservice that imports Bitcoin transactions in Neo4j. The service uses the WebSocket client library to listen for transactions through the Blockchain WebSocket.
Since the transactions themselves don’t provide the USD conversion value, I’ve added a function that updates the Bitcoin conversion ratio once per hour and uses it to calculate the transaction and flow values in USD.
Since the WebSocket randomly drops connection every five to ten thousand transactions, I’ve included the code to handle any WebSocket errors and reconnect automatically.
The only missing thing is the code that is executed when a new transaction is transmitted through the WebSocket. You can examine the structure of the response on the Blockchain website.
The data contains information about the inputs and outputs of the transaction as well as its hash and timestamp. For a more straightforward analysis, we will also preprocess the total and flow values of the transactions and the USD equivalent of BTC values.
The Bitcoin values are represented as Satoshis, so we need to divide the value by 100 million to get transaction values in BTC. Google says there are around 300–400 thousand Bitcoin transactions per day, which amounts to approximately five transactions per second. At first, I thought I would need to utilize some sort of batch import to handle this volume, but it turns out we can import one-by-one transactions without any problems. I’ve left the service running for 48 hours at this point in time, and no errors appeared with this approach.
The whole project consists of three docker services and their configuration as a docker-compose file.
After you have defined the unique constraints in Neo4j with the define_schema.shscript, you can simply execute docker-compose up command to begin storing real-time Bitcoin transactions in Neo4j.
Finally, I’ve used the NeoDash tool to prepare a simple dashboard to monitor overall transaction statistics as well as having the option to drill down specific addresses or transactions in the database. The NeoDash is available as a Neo4j Desktop application and a standalone docker instance. In our case, we will utilize the standalone docker instance. I’ve added the dashboard settings and the instructions on how to set it up in the readme of the repository.
If you have used the docker-composecommand, the NeoDash will be available on port 80. The first tab of the dashboard provides overall transaction statistics, largest transactions, and incoming address flows for the last 24 hours.
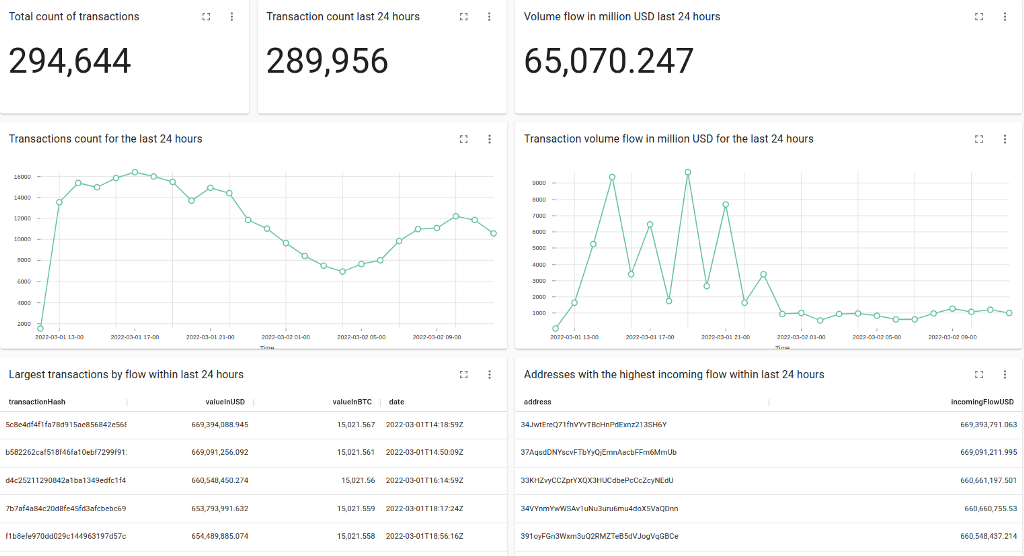
Interestingly, the count of transactions drops a bit during the European night. For example, let’s say you have identified a specific address you want to investigate further. On the second tab of the dashboard, you have the option to input the address id as a parameter, which will allow you to drill down a specific address.
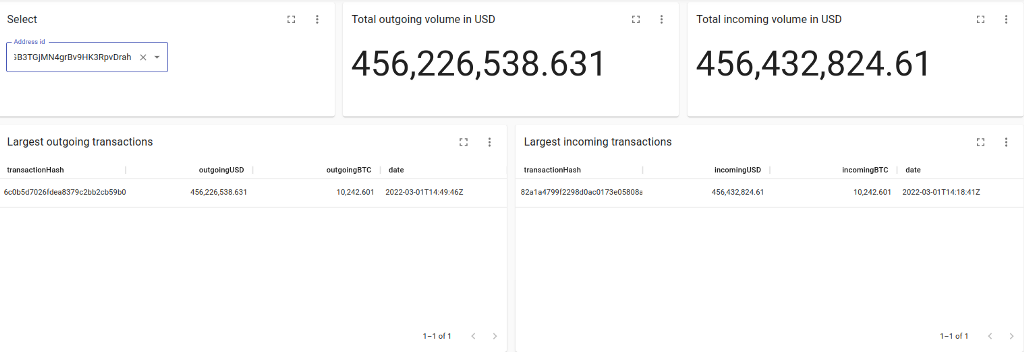
I’ve picked one address that came up in the list with the highest incoming flow. It seems that an address received ten thousand BTC on the first of March and in less than 30 minutes forwarded it forward to the next address.
Lastly, I’ve prepared a dashboard tab that allows you to inspect a single transaction.
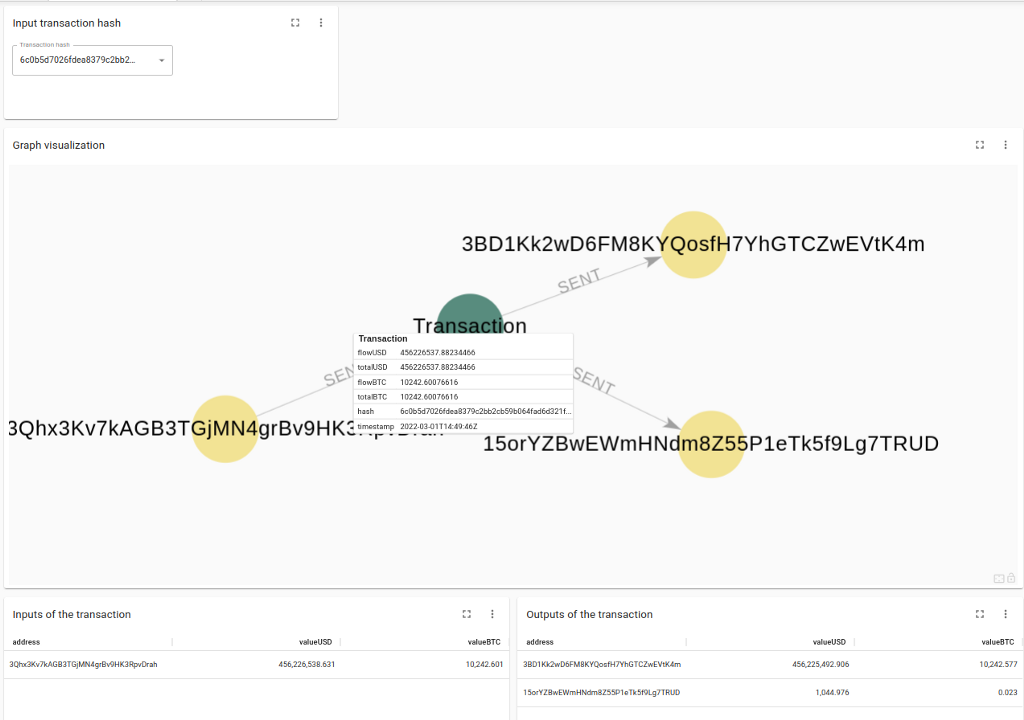
I didn’t realize that this kind of volume is moved through the Bitcoin network. For example, I’ve identified a couple of transactions with more than 500 million USD value flow. Since the data is stored in Neo4j, you have the complete flexibility of Cypher as well as the graph algorithms features in the Neo4j Graph Data Science library to search for interesting transaction patterns.
For instance, I’ve identified a transaction worth 15 thousand BTC and then analyzed how the value dispersed through the network.
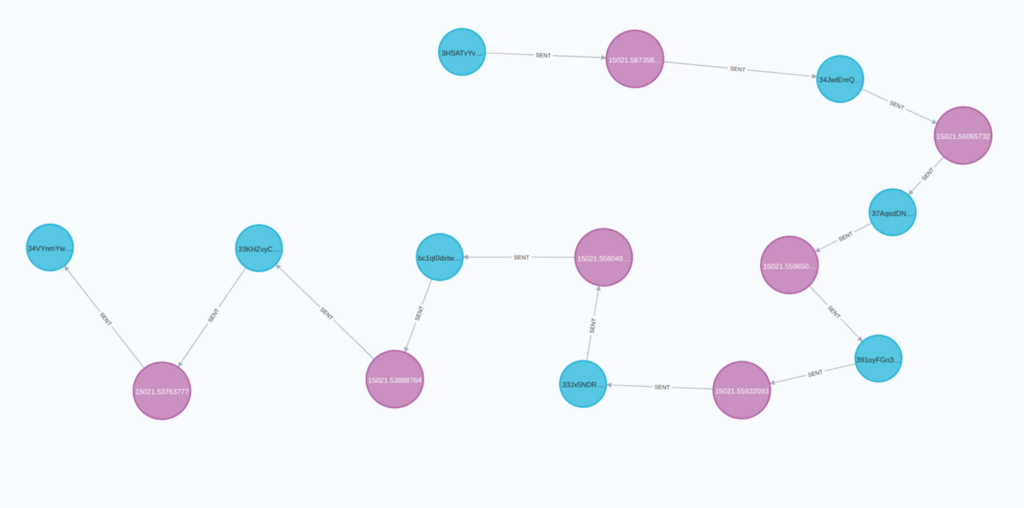
It seems that on March 1, 2022, someone initiated the value flow by sending 15 thousand BTC to another account. Note that the USD equivalent of the transaction flow is more than 650 million USD. The Bitcoins were then sent through 6 different accounts to their final destination in the span of six hours.
Conclusion
By core, all the transactions in the Bitcoin network are publicly available and easily accessible in real-time for us to analyze them. So, if you want to do some academic research or dive into forensic investigation, I hope this post and the accompanying code can help you get started. Test it out and let me know if you have any ideas on improving the code or any interesting use cases by adding an issue to the repository.
We haven’t yet used any advanced Cypher techniques or graph algorithms to examine the Bitcoin transactions, so stay tuned, as that will probably be my next post.
As always, all the code is available on GitHub.
P.S. I’ve later found that a project that imports the whole Bitcoin history into Neo4j as well if you are interested.
Real-Time Dashboard of Bitcoin Transactions With Neo4j and NeoDash was originally published in Neo4j Developer Blog on Medium, where people are continuing the conversation by highlighting and responding to this story.
Share Article


Explore
Related Articles
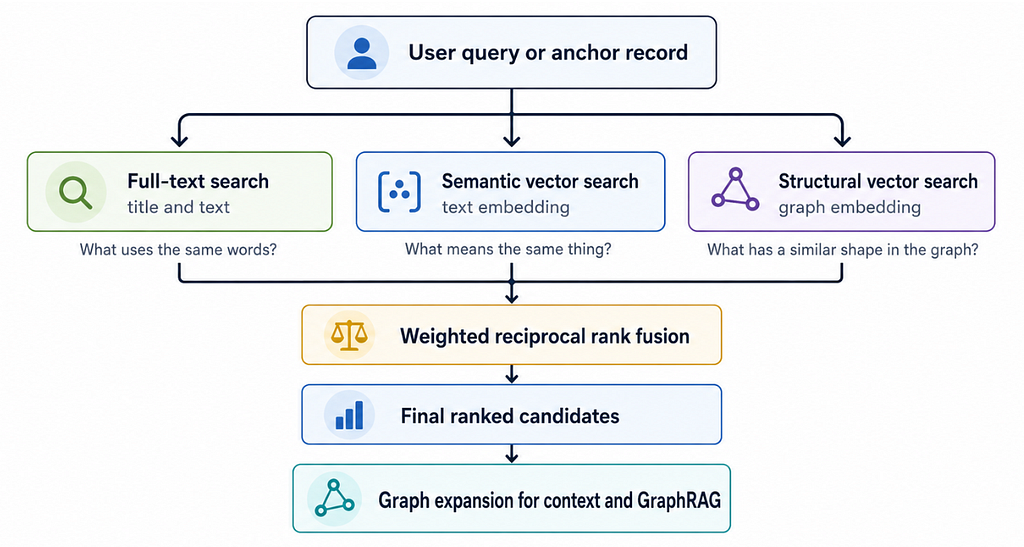
Hybrid Search in Neo4j: Full-Text, Vectors, and Graph Topology with Cypher


Zero-Copy Graph Reasoning on Snowflake: Getting Started With Neo4j Virtual Graph