Graph Data Science for supply chains – Part 3: Pathfinding, optimization, and what-if scenarios

AI Research Engineer, Neo4j
20 min read

Using Neo4j Graph Data Science to understand and improve your supply chain performance

In this post we demonstrate how Neo4j Graph Data Science can be applied to supply chain data to:
- Find new, faster, paths through supply chain processes with potential to improve performance by up to 40%,
- Facilitate enhanced downstream optimization for freight forwarding and supply chain problems in general, and
- Conduct what-if simulations to quickly identify alternative routes under delay/failure scenarios and enable deeper risk assessment around critical and high centrality supply chain stages.
Introduction
Route optimization, resource allocation, and risk management are critical aspects of operating high-performance supply chain and logistics networks. Depending on the business area, specialized software leveraging traditional mathematical modeling and simulation may already exist to help solve these problems. However, applying graph data science in the right places can greatly improve efficiency and offer critical insights that are otherwise difficult to obtain with traditional methods.
We will demonstrate this application of graph data science through examples using the real-world Cargo 2000 Case Study dataset, the same dataset we used in the first two parts of this series. We will start with a brief recap and overview of shipment routes in the dataset. After that, we will explore pathfinding to show how we can identify new and faster shipment routes, walking through a specific example that reveals potential to improve performance by up to 40%. We will then show how pathfinding algorithms can be used to facilitate downstream optimization problems enabling a freight forwarding recommender that returns results in a matter of just a few seconds. Lastly, we explore how these pathfinding algorithms can further be used in what-if scenario simulations to better understand alternative routing and conduct risk assessment.
It is worth noting that while we are using an air cargo freight forwarding dataset in this post, these same techniques can be applied to other types of logistics, including maritime and trucking services, as well as other types of supply chain domains, including manufacturing, inventory management, and bill of materials.
As always, the data and ipython notebook to replicate this analysis end-to-end can be found on GitHub.
Dataset recap & shipment routes
A full overview of the Caro 2000 Case Study Dataset is available in part 1. To summarize here, the case study data comprises tracking and tracing events from a forwarding company’s system for a period of five months. It represents a series of business processes in which up to three smaller shipments from suppliers are consolidated and then shipped together to customers. The business processes are structured into incoming and outgoing transport legs, with the overall objective that freight is delivered to customers in a timely manner.
In the last two parts of this series we have primarily worked with a collapsed form of the Cargo 2000 Case Study network using the SENDS_TO relationship. Since we are concerned with specific shipment paths in this part of the series, we will work with the full data model depicted below.
 Figure 1: Graph Data Model
Recall from part 1 that each leg in a shipment, incoming and outgoing, has the potential for multiple connecting flights. For reference, below is an example of what a single shipment looks like in the graph with three incoming legs originating from Davidburgh, Paulchester, and Moodytown, and outgoing leg going to Davisfort.

Figure 2: Example End-to-End Shipment
With this data model we can pull the total effective minutes for historic shipments paths with a Cypher query. Below is a distribution of total time for paths going from Moodytown to Davisfort, one of the most frequent paths in the network. You can see the notebook if you are interested in understanding the Cypher query used to obtain these results.
 Figure 3: Moodytown to Davisfort Duration Distribution
Notice the distribution has a long right tail. This is characteristic for many of the other routes where most shipments fall into a tight range of duration times, with a few extreme cases that have much longer times, sometimes ten or more times greater than the median.
Identify faster routes and improve performance with pathfinding
GDS has a robust family of 10+ graph algorithms for pathfinding. These algorithms can be used to explore, recommend, and optimize paths in supply chains. To highlight just a few of these algorithms:
- Dijkstra’s Source-Target Shortest Path is a classic graph algorithm for finding the shortest path between two nodes
- Delta-Stepping Single-Source Shortest Path uses parallelized computation to find the shortest paths between a single source node and multiple target nodes.
- A* Shortest Path is an extension of Dijkstra that uses heuristics to speed up computation. Particularly well-suited for paths between geospatial points
In this post we will focus on another pathfinding algorithm called Yen’s K-Shortest Path. Yen’s algorithm is similar to the Dijkstra’s Source-Target Shortest Path, but while Dijkstra calculates only a single shortest path between a source node and target node, Yens can find multiple, “top k”, shortest paths between a source and target. This will prove useful later for recommending freight forwarding combinations.
Yen’s algorithm, along with most other GDS pathfinding algorithms, can be weighted with relationship properties to take variable costs associated with time, distance, and other operations into consideration. In this case we will use the average effective minutes of the business processes. This will allow us to find paths that minimize the approximate average time, which we will refer to as the “fastest” paths. There are some statistical considerations to keep in mind when using averages this way. Depending on your use case you may also want to choose a different type of aggregate measure. I cover this in more detail in the appendix. If you are considering using this type of solution in a production capacity I recommend reading it. For now though, the following steps provide a good starting point for pathfinding based on historical data.
The below Cypher projection aggregates parallel relationships and creates the average effective time relationship property.
g, _ = gds.graph.project.cypher('proj',
   '''
  MATCH(n)
  WHERE n:EntryPoint OR n:DepartureWarehouse OR n:DeparturePoint OR n:ArrivalWarehouse OR n:TransferPoint OR n:Destination
  RETURN id(n) as id, labels(n) as labels
  '''
   ,
   '''
   MATCH(n0)-[r:RECEPTION|DEPARTURE|TRANSPORT|DELIVERY]->(n1)
   RETURN id(n0) AS source, id(n1) AS target, type(r) AS type, avg(r.effectiveMinutes) AS averageEffectiveMinutes
   '''
)
After you project the graph you can begin with pathfinding. For our first example, let’s get the top 10 shortest paths going from Moodytown to Davisfort.
source_node_id = gds.find_node_id(['EntryPoint'], {'name': 'Moodytown'
})
target_node_id = gds.find_node_id(['Destination'], {'name': 'Davisfort'
})
yen_df = gds.shortestPath.yens.stream(g, sourceNode=source_node_id, targetNode=target_node_id, k=10, relationshipWeightProperty='averageEffectiveMinutes')
def get_airport_names(p):
   return ' -> '.join(list(dict.fromkeys([node.get('name') for node in p.nodes])))
yen_df['airportPath'] = yen_df.path.apply(get_airport_names)
top_path_df = yen_df[['airportPath', 'totalCost']].rename(columns={'totalCost':'approximatedAvgCost'})
top_path_df.to_csv('out0.csv')
 Figure 4: Top 10 Shortest Paths
Notice that the best path is a direct flight from Moodytown to Davisfort. By nature of the freight forwarding model, we don’t have deliveries going directly from source to destination in the dataset. We will see later with freight forwarding combinations that there are opportunities for reducing total costs by taking longer routes through connecting airports which motivates the use of multi-step paths despite them sometimes taking longer on average.
Let’s compare the above paths to those historically taken in the dataset. We will do this by merging the above results to actual historic paths which we can pull with Cypher. Below is the resulting dataframe.
 Figure 5: Shortest Paths Compared to Historic Routes
Notice that the second best path through Michaelstad is by far the most frequently used route historically. However, there still seem to be many routes that aren’t reflected in our shortest path recommendations. For example, there are 11 instances going through Scottstown which isn’t even in the top 10 recommended paths, as well as 5 through Amandachester and 4 through Simonfurt.
Improving performance by selecting new routes
While Scotttown was heavily utilized historically, our application of GDS pathfinding revealed multiple other faster options. We are already routing many flights through Michaelstad, so what if we routed the Scotttown flights through Wandaborough instead which has a very similar approximate average time to the Michaelstad path?
With a bit of arithmetic, we can estimate that by switching the Scotttown flights to go through Wondaburough instead, we could see an approx 40% decrease in average time which is rather significant.
To calculate this, it is important to note that the approximate average times from our Yen’s shortest paths and the actual historic average times won’t be exactly the same for a variety of reasons. These include large variance in flight times and the fact that shortest paths tend to go through flight segment connections rather than proper TransferPoints (points where incoming and outgoing legs connect in the graph schema triggering another freight reception process). Nevertheless, the shortest path approximate average times and the historic average times should be well correlated, and, if we assume they are relatively proportional, we can estimate differences in performance between paths. For the above example, we can note that the Wondaburough connected path (#3) is only slightly longer than the Michaelstad connected path (#2) and that the average historic time of the Michaelstad connected path is under 60% that of the Scotttown connected path (#11). A bit of percentage calculations will allow you to reach the solution I came to above.
Downstream optimization and recommendation
Once we can find shortest paths we can use them in downstream optimization and recommendation to aid decision making in supply chains. In this case we will use them for freight forwarding combinations. Optimization in supply chain networks is a broad and complex topic often involving multiple objectives relating to revenue, time, and expenses as well as constraints around resources, equipment, and other assets. From a technical standpoint, this can involve linear and nonlinear programming techniques as well as discrete optimization. Going into depth on these techniques is out of scope for this post. However, I will walk through a simple example of using shortest paths to optimize and recommend freight forwarding combinations. This should provide you with enough tooling to get started with using graph data science for your own supply chain optimization problems.
Consider you have 4 shipments going to Sandersshire from the airports
- Bradleymouth,
- Moodytown,
- Richardberg, and
- Wandaborough.
We could simply use the shortest path for each route. This results in the below solution visualized in Bloom:
 Figure 6: All Shortest Path Solution in Bloom
 However, this may not be the best overall solution. We could instead choose paths that allow us to better consolidate freight on different legs, allowing us to use less airplanes, less overall resources, and reducing cost.
Minimal cost objective for freight forwarding
To keep things simple, let’s find a freight forwarding solution that minimizes total average time across all paths in the graph. Instead of finding a single shortest path, we want to find the set of paths that minimize total cost across all business processes. For the mathematically inclined, I include a more formal definition in the appendix. Basically, if multiple paths go through the same airport, the business processes (expressed as relationships) for that airport including transport, departure, reception, and delivery will only be counted once. This reflects a cost minimization problem, with a constant variable cost across all business processes. Obviously, for real world application, you may need to vary the cost per business process or develop other rules around how overlapping paths affect total costs, all of which can be accomplished by altering/extending the objective function.
It is worth noting that without a graph oriented approach, this problem can be practically impossible to solve given the large number of potential paths between any two nodes. For reference, a brute force approach would have a time complexity of up to O([n!]S) where n is the number of nodes and S is the number of sources. Graph oriented approaches cut down on this with a combination of pathfinding algorithms and approximate optimization methods. With the Neo4j Graph Data Science implementation of Yen’s pathfinding algorithm, we can solve this problem in a manner of seconds on this dataset. By selecting candidate paths for each source with Yen’s algorithm first, the time complexity we must deal with downstream reduces to O(ks) where k is the number of top-k paths selected for Yen’s algorithm. So if we opted for top 20 paths from 4 shipment routes, this comes to 160,000 potential solutions which is very feasible to search over. Yen’s has its own associated time complexity, but this is managed internally within GDS which is designed and tuned specifically for high-performance in this area.
Recommending freight forwarding combinations for Sandersshire
This notebook has the code for running the Sandersshire freight forwarding problem. Below is a table of the top 5 solutions. From here forward we will show the cost in minutes. To reiterate, these minutes reflect the total time of all the paths, not the duration for all the freight forwarding legs to complete which will usually be shorter.
 Figure 7: Top 5 Freight Forwarding Solutions
In the above figure, the solutions index column tells you the rank of the shortest path chosen for each incoming leg in alphabetical order of airport name. So for the best solution in the top row, (1, 0, 1, 0) reads as using the second fastest path for Bradleymouth, fastest for Moodytown, second fastest for Richardberg, and the fastest for Wandaborough. This top solution results in all four incoming legs getting consolidated in Shanefort for a single outgoing leg. Below is a visual depiction of the top solution in Bloom.
 Figure 8: Top Freight Forwarding Solution in Bloom
Adding constraints
It is possible to add constraints to this form of problem as well. For example, we can put a constraint on max time such that no single path in the solution can be over a certain number of minutes.
Like with the previous example, the code for running the constraint problem is in the notebook. To demonstrate, I set the max time to 10 hours and it results in the below top 5 solutions.
 Figure 9: Top 5 Freight Forwarding Solutions with 10 Hour Max Time Constraint
Note the best solution is now the same as the combination of all best paths, same as is visualized in Figure 6 above. While the max time is lower, the freight is not getting consolidated completely in outgoing legs.
Some of the other top solutions are interesting to consider as well. For example, the second best solution, visualized in Bloom below, is very close in total average time to the best, but takes a very different approach, routing everything through Davisfort except for Richardberg which is left as a direct path.
 Figure 10: Freight Forwarding, 2nd Best Solution with 10 Hour Max Time Constraint
What-if scenarios and pathfinding
You can also use pathfinding to help simulate what-if scenarios, such as predicting the effect of delays, changes in resources, external shocks, or other new occurrences on the supply chain. This can be applied in a couple different ways:
- Alternative Routing: Find next best options in the event of failures or significant delays.
- Risk Assessment: Perform analysis to understand the effect of failures, significant delays, or other issues on supply chain performance.
Alternative routing
As an example of alternative routing, let’s assume that Shanefort becomes overloaded and, in conjunction with bad weather, is no longer a viable connection/transfer option for freight forwarding. With Neo4j Graph Data Science we can quickly simulate this scenario by using our freight forwarding recommender after excluding Shanefort from the graph projection. Below is a table of the top 3 alternatives as well as their visualizations in Bloom.
 Figure 11: Top 3 Alternatives


Figure 12: Top 3 Alternatives Visualized in Bloom
You can see how these alternative routes substitute different airports for Shanefort. The best alternative (Alternative 1) takes a total average time of 15,227 minutes, an approximate 8.2% increase from the best original solution with Shanefort above. While there is some impact to performance, we see that we can likely re-route shipments to keep the supply chain functioning.
What-if scenarios for risk assessment
Due to the complex and interdependent nature of supply chain networks, significant risks can develop inconspicuously when thorough risk assessment is overlooked.
What-if scenarios can be used as part of the risk assessment process to understand how the network will perform when encountering significant delays, shortages, and/or failures.
As an example, suppose Richardberg experienced significant delays in their management of ground resources resulting in the average times for departure and transport processes to increase by a factor of 3. What effect would this have on freight forwarding?
If we rerun our freight forwarding recommender under these conditions we obtain the same top 5 path combinations as we did previously in figure 7, however all the times are increased.
 Figure 13: Top 5 Freight Forwarding Solutions With Richardberg Delay
The best result now has a total average cost of 16,520 minutes, a 17% increase from our previous best solution of 14,069 minutes. This makes sense since, while Richardberg is one of the four source airports, it is not prioritized heavily as a transfer point in our paths.
Now suppose the situation was a bit worse and we saw similar delays in both Davisfort and Shanefort. At that point we would get a completely different top 5 solutions all with substantially longer times.
 Figure 14: Top 5 Freight Forwarding Solutions With Multiple Delays
The best solution, visualized in Bloom below, has a total average cost of 22,628 minutes, a 61% increase from our previous best solution of 14,069 minutes.
 Figure 15: Best Freight Forwarding Solution Under Multiple Delays in Bloom
As we covered in part 2 of this series, high centrality nodes, particularly those with high betweenness and/or eigenvector centrality, are more prone to causing bottlenecks and propagating delays and other issues. As such, they can pose a higher risk to overall supply chain performance. We see this reflected in the above example. In part 2 we found that Richardberg, Davisfort, and Shanefort are some of the most high centrality airports in the network. Despite Davisfort and Shanefort being neither the source nor target airports in the above what-if scenario, simulating delays on those airports after Richardberg was already experiencing them resulted in a 44 percentage point increase in total average time, even after considering alternative routes in freight forwarding optimization. Ultimately, these highly central airports are strongly depended upon as transfer points and connections in freight forwarding. If you experiment with other sets of source and target nodes in the network you should find strong dependence on the same small group of central airports.
Wrapping things up
In this post we explored how Neo4j Graph Data Science pathfinding can be applied to generate critical insights for supply chain and logistics networks. We were able to identify new and potentially faster shipment routes in our dataset. We showed how pathfinding, and Yen’s algorithm specifically, can be used as inputs for downstream optimization problems, speeding up computation and providing information that would otherwise be difficult to capture without a graph data science approach. Finally, we covered the application of pathfinding in what-if scenarios that can be used to find alternative routes, help perform risk assessment, and understand the criticality of high centrality airports in the network.
As stated throughout the post, all the code in the form of a python notebook as well as directions for loading the dataset can be found here on GitHub.
We are just scratching the surface here. While the example dataset we used consisted of freight forwarding for air cargo, these same techniques can be applied for a broad range of other supply chain problems. These include other types of logistics, such as maritime shipping and trucking services, as well as other types of supply chain domains, including manufacturing, inventory management, and bill of materials.
Appendix
Note on using averages and interpreting results
In this post we used average times in our graph projection to find shortest paths, specifically the arithmetic mean of effective minutes. The arithmetic mean can serve as a good summary measure for overall recommendation and analytics, but one must be careful not to fall into “flaw of average” assumptions while using it. In the context of our problem, what this means is that while we approximate what average times will be over many shipments in our pathfinding recommendations, it is possible for individual shipment times to be shorter or much longer than the approximation averages. As such, the predicted average times should not be relied upon with low/zero tolerance for delays or early arrivals on an individual shipment-by-shipment basis.
Additionally, you may want to change the type of aggregate measure depending on your supply chain use case. For example, if your performance is really sensitive to long delays but robust to otherwise smaller variances in times, you may consider using the 95th percentile, or similarly higher percentile of the distribution instead of the arithmetic mean. On the other hand, if your data rarely has long delays and you would like to exclude them as outliers, using the median instead of the arithmetic mean can help with that.
Freight forwarding objective function
To define the objective function for optimizing freight forwarding recommendations let r ∈ E be the ith relationship in the graph, so E reflects the set of all relationships. Then let pjs t ⊂ E be the jth path from source node s to target node t and suppose you have a total of S sources, s ∈ {1,2,…,S}
Then define the freight-forwarding solution as the union of all the paths

and our objective becomes

where c:E → ℝ is the cost function for each relationship, in this case returning the approximate average time property.
Freight forwarding objective with max time constraint
If one puts a constraint on max time, such that no single path in the solution can be over m approximate average minutes, the optimization becomes:

Share Article


Explore
Related Articles
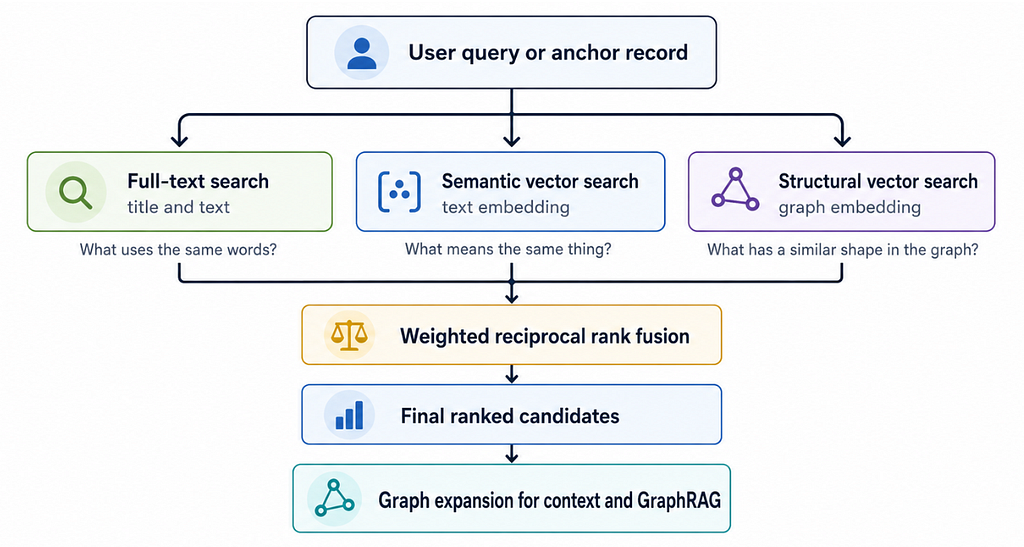
Hybrid Search in Neo4j: Full-Text, Vectors, and Graph Topology with Cypher