Graph Databases Offer a Deeper Understanding of Organizational Risk

Security Risk Analyst, Neo4j
2 min read

This post was written with sponsorship from David Fox, Neo4j CISO, an experienced security & risk practitioner and leader who joined Neo4j two and a half years ago, wanting to use graph technology to help provide a better understanding of risk.
Until recently, Neo4j used a traditionally structured risk register to manage organizational risk. Risk registers, or risk logs, are popular tools, but they have some key limitations. Risk data is often stored in a spreadsheet or relational database, and the output is either a numerical assessment or graphical representation—a standard 5×5 matrix or traffic-light system. These one-dimensional views tend to lack finesse, encourage siloed thinking, and focus on process.
Our risk register suffered from these and other weaknesses, including inconsistency, arbitrary risk scores, siloed thinking, and duplication, all of which reduced confidence in the process. The Governance, Risk, and Compliance (GRC) team often had to cajole people into using the risk register.
So, we moved our corporate risk register into a graph database and immediately had a much better understanding of the risks we faced.
Data Model and Querying
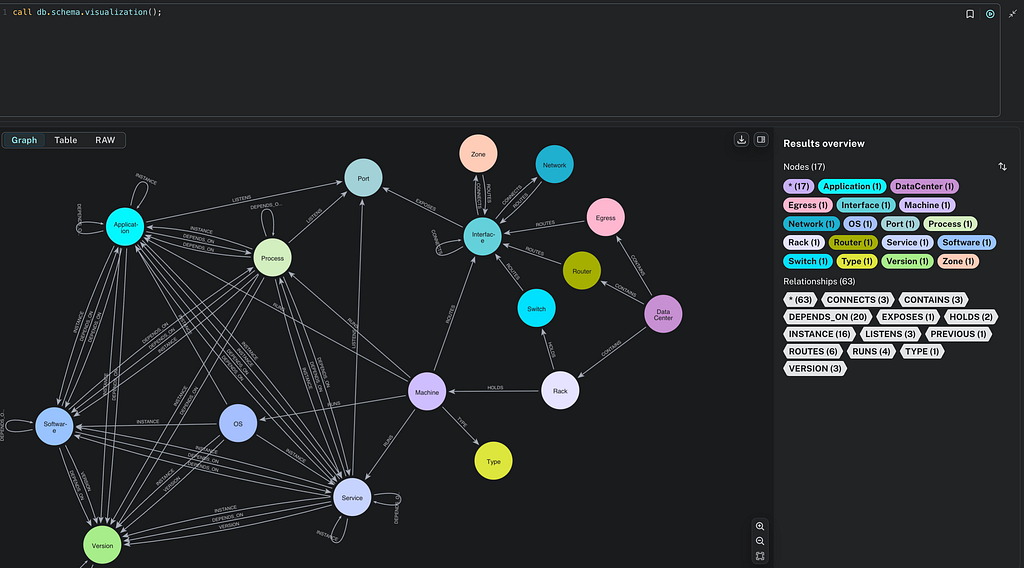
After some exploratory analysis, we developed the following model for our risk data (Figure 1):

Figure 1: Schema diagram to show the graph data model.
The graph structure allows us to model the relationships that help define a given risk, such as the relationship between risks and vulnerabilities (Figure 2) and the relationship between business departments and assets (Figure 3).

Figure 2: Graph showing the relationship between risks (red) and vulnerabilities (blue).

Figure 3: Graph showing the relationship between assets (brown) and departments (green-yellow).
We were also able to see beyond these simple relationships and identify, for example, risks that impact multiple assets—the blast radius of the risks (Figure 4).

Figure 4: Graph showing the blast radius of three risks on departments.
This knowledge, which our traditional risk register could not have provided, can be used to re-assess the severity of a risk.
Common Queries
What else does our graph model allow us to do? A common query or subquery usually involves checking for open risks. In our data model, the last Progress node on a treatment plan denotes if a node is opened or closed. The query to get the last Progress node of each risk is as follows:
MATCH (r:Risk)-[:RISK_HAS_PLAN]->(:Plan)-[:NEXT_PROGRESS*]->(end:Progress)
WHERE NOT EXISTS { (end)-[:NEXT_PROGRESS->() }
RETURN end
This query works by first traversing the chain of Progress nodes and returns the last one in this chain due to the WHERE clause, which states that the node must not have an outgoing relationship to another Progress node.
We can easily modify this query to get all open risks by adding {closed: True} as a property of Progress in our pattern match and returning r.
Another common query can be used to return the graph of relationships between assets and business units:
MATCH path=(:Asset)<-[:USES|OWNS]-(:BusinessUnit)
RETURN path
Now, let’s examine our dashboarding tool and some advanced uses of Neo4j, including vector indexes and our Graph Data Science (GDS) library.
Dashboarding
We opted to use NeoDash, a popular dashboarding tool for interacting with Neo4j databases. It allows us to present data for different user groups, giving a typical summary view, a granular view of the register for risk analysts, and a high-level view for executives.
NeoDash visualizations allow people unfamiliar with Cypher to interact with the database. We’ve even set up our dashboard prototype to include data input so Cypher queries are hidden from the risk analyst. We’ve provided a demo of our dashboard with mock data on NeoDash, so you can experiment with a practical example.
Advanced Applications
We’ve identified a number of applications for using the graph database. Along with graph algorithms and machine learning, we’ve provided a summary of how these algorithms work, along with a more technical description.
Identifying Crown Jewel Assets
Modeling risk in a graph makes it easier to visualize and ask questions about the data. One question is: How can we identify important assets—the crown jewels—within an organization? We can assign a value to the relationship between an asset and a department, where the value is the average financial loss across all risks involving that department and asset. This gives us a value that represents the financial impact of the asset on a department, allowing us to identify crown jewels where this relationship value is above a certain threshold.
Maximal Impact With Minimum Assets
Neo4j’s GDS library allows us to use this relationship to view the maximum damage possible with the minimum number of assets. An adaptation of the Minimum Steiner Tree algorithm available in the library helped us answer this question (Figure 5).

Figure 5: Graph showing the minimum number of assets to cause maximum damage to the whole business.
We can think of this problem as a Minimum Spanning Tree problem, where departments should be connected through assets. This can then be framed as a Minimum Steiner Tree problem, with target nodes being the departments, the source node being a particular department, and relationships only being traversed between assets.
To select the maximum impact, we need a property that stores an inverted impact score, where the largest impact becomes the smallest impact, in order to apply the Minimum Steiner Tree algorithm. We need to connect every asset to the source department, with a weight close to infinity, so that it is never selected as a shortest path but will act to connect disconnected subgraphs. We can delete these edges and show the graph as disjoint trees after applying the algorithm.
Risk Description Similarity Search
We can use this concept to find similar risks based on their description, reducing the duplication in the risk register and allowing us to focus on distinct risks.
Text descriptions can be embedded as a vector (a list of numbers), representing this text in a numerical format. This allows us to measure the “distance” or “angle” between text descriptions, allowing us to see similar risks.
Each risk description had its vector embedding pre-computed using an OpenAI model. We create a vector index on this property, allowing us to do a cosine similarity search to detect risks with a similar description. This is a common pain point with corporate risk registers, and we have currently integrated it with our dashboarding tool to ensure we reduce duplicates.
Predicting Severity Scores
We can reduce subjectivity by training a machine-learning model to predict the impact and probability ratings of a risk from the text description. This approach can spot outliers and prompt users to double-check their rating before they submit a risk or review a register to identify less-than-optimal ratings.
Using GDS, we projected the graph natively with node embeddings from assets, threats, and vulnerabilities. A graph projection is essentially a subgraph on which the machine-learning task is performed, and the node embeddings are used to represent each node. This allows our model to take the text embedding and nodes into account. With the node embeddings and text embeddings as features, we can predict the risk impact rating or probability rating.
We trained various regression models, with the most effective being a random forest model with 500 decision trees and a maximum depth of 10, allowing accurate predictions without too much overclassification.
Less Subjectivity, Fewer Duplicates, Deeper Understanding
This project demonstrated that modeling a risk register in a graph database can reduce the subjectivity of risk assessments, reduce duplicate risks, and improve decision-making by providing a deeper understanding of risk. Throughout this process, further analysis has always led to more questions, prompting further analysis.
Output could be further enhanced by integrating an asset register to gain more granularity between the relationships of assets and departments, along with adding multiple assets affected by a risk. It’s possible that incorporating a Configuration Management Database (CMDB) would improve understanding of blast-radius analysis.


