Hands on graph data visualization

Head of Product Innovation & Developer Strategy, Neo4j
9 min read
Using graph visualization frameworks with the Neo4j graph database
It turned out that there is much more content on graph visualization that it fits into one article, so we will turn this into a series of indefinite length.
We hope you enjoy it. Please let us know in the comments.
Introduction: Querying data from Neo4j
A graph database stores its data as nodes and relationships each with type and attributes. That makes it easy to represent connected, real world information to find new insights in the data.
To visualize the stored data, we often use Javascript data visualization frameworks.
This time, we’ll be not drawing charts or maps but graphs, aka. networks. You can do the former easily too by using aggregation or geo-information drawn from the graph but that’s for another time.
To query a Neo4j database we use Cypher a pictorial graph query language, that represents patterns as Ascii Art.
Where we …
MATCH (a:Node)-[con:CONNECTED_TO]->(another:Node)
RETURN a, con, another
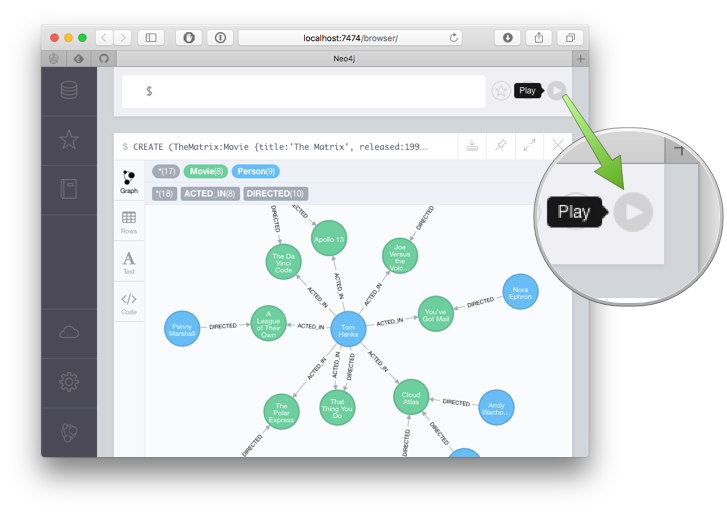
If you haven’t installed Neo4j, you can do that quickly with Neo4j-Desktop. After installation just create a project and a graph, start up the engine and open Neo4j Browser (which itself is a React Application). In the command line on top, type :play movies graph and click on the 2nd slide the create script, run it once and you should have a basic dataset for playing around.
You can also just spin up a Neo4j Sandbox which have many different datasets available, e.g. Twitter, Paradise Papers, Movie recommendations and more. For an empty database just use a “Blank Sandbox” and then create the movie database as above. Note your password, the server ip-address and the bolt port (not HTTP!).
So the simplest and fastest query is:
MATCH (first)-->(second)
RETURN id(first) AS source, id(second) AS target
This query can pull a million relationships from a graph in a single second, much more than most visualization frameworks can visualize.
It only retrieves the graph structure which is useful when zoomed out.
For more details we might want to know labels of nodes and types of relationships, so we can color each accordingly.
MATCH (first)-[r]->(second)
RETURN { id: id(first), label:head(labels(first)) } AS source,
       { type:type(r) } as rel,
       { id: id(second), label:head(labels(second)) } AS target
If we want to we can return more detail, e.g. caption, sizes, clusters, weights:
MATCH (first)-[r]->(second)
RETURN { id: id(first), label:head(labels(first)),
         caption:first.name, size:first.pagerank,
         cluster:first.community } AS source,
{ type:type(r), size:r.weight } as rel,
       { id: id(second), label:head(labels(second)),
         caption:second.name, size:second.pagerank,
         cluster:second.community } AS target
Those queries return incrementally more data, so perhaps it’s more sensible to pull that additional information only if the user zooms in.
Then we can provide a list of already loaded, visible ids (with the first query) as filter:
MATCH (first)-[r]->(second)
WHERE id(first) IN $ids AND id(second) IN $ids
RETURN
    { id:id(first),label:head(labels(first)),caption: first.name,
        size:first.pagerank, cluster:first.community } AS source,
    { type:type(r), size:r.weight } as rel,
    { id:id(second),label:head(labels(second)),caption:second.name,
       size:second.pagerank, cluster:second.community } AS target
You can pre-set params in Neo4j-Browser with :param ids:[1,2,3]
For the full detail information of a node (with all possible properties), we can load that data when the user hovers or clicks on the node:
MATCH (node)
WHERE id(node) = $id
RETURN { id: id(node), label:head(labels(node)),
         caption:node.name, size:node.pagerank,
         cluster:node.community,
         outDegree: size((node)-->()), inDegree: size((node)<--()),
         .* } AS details
Loading data with the JavaScript driver
Querying data with the Neo4j Javascript Driver is very performant and quite straightforward, I’ll mention the one only weirdness as we get there.
You can add the driver via npm, or via CDN (rawgit) to your project.
Let’s start by querying with the node shell:
npm install neo4j-driver
node
import module, create a driver
const neo4j = require('neo4j-driver');
# for local installation
const driver = neo4j.driver('bolt://localhost',
                            neo4j.auth.basic('user', 'password'));
# for sandbox
const driver = neo4j.driver('bolt://serverip:boltport',
                            neo4j.auth.basic('user', 'password'));
If the connection fails, please check that
- your server is running,
- the address (esp. in the remote case) and
- the authentication.
create a session
const session = driver.session({database:"dbName"});
get a single node
var query = "MATCH (n) RETURN n LIMIT 1";
var _ = session.run(query).then(console.log);
result datastructure
{ records:
   [ Record {
       keys: [Array],
       length: 1,
       _fields: [Array],
       _fieldLookup: [Object] } ],
  summary:
   ResultSummary {
     statement: { text: 'MATCH (n) RETURN n LIMIT 1',
                  parameters: {} },
     statementType: 'r',
     counters: StatementStatistics { _stats: [Object] },
     updateStatistics: StatementStatistics { _stats: [Object] },
     plan: false,
     profile: false,
     notifications: [],
     server: ServerInfo { address: 'localhost:7687',
                          version: 'Neo4j/3.3.4' },
     resultConsumedAfter: Integer { low: 0, high: 0 },
     resultAvailableAfter: Integer { low: 4, high: 0 } } }
We see the attribute records, each of which has a keys, a get(key) method, and private _fields and _fieldLookup attributes. Also there is a summary with resultConsumedAfter/resultAvailableAfter timing, statement, counters, plan, notifications, serverInfo.
return keys and values for each record
var _ = session.run(query).then(
          result => result.records.forEach(
              r => console.log(r.keys, r.keys.map(k => r.get(k)))));
We see that unexpected Integer type, which is the “number” type of the Neo4j driver, due to Javascripts inability to represent whole numbers > 2^53 You can call value.toNumber() on it, more details in the docs/readme of the neo4j-javascript-driver
turn single record into an object
var query =
 `MATCH (n:Movie)
  RETURN id(n) as id, labels(n) as labels, n.title, n.released
  LIMIT 1`;
var _ = session.run(query).then(result => console.log(result.records[0].toObject()) );
{ id: Integer { low: 0, high: 0 },
  labels: [ 'Movie' ],
  'n.title': 'The Matrix',
  'n.released': Integer { low: 1999, high: 0 } }
performance test
A small performance test on my machine using a cross product which we limit to 1M results with 3 values each.
var query =
       'MATCH (n),(m),(o) RETURN id(n), id(m),id(o) LIMIT 1000000';
var start = new Date();
var _ = session.run(query).then(result => console.log(result.records.length,new Date()-start,"ms"));
> 1000000 1970 ms
It shows that it takes a bit less than 2 seconds to retrieve that 1 million rows. If we were processing that data in a streaming manner and not build up a large array, it is much faster (less than 1 second).
var query = `MATCH (n),(m),(o)
             RETURN id(n), id(m),id(o) LIMIT 1000000`;
var count = 0;
var start = new Date();
var _ = session.run(query).subscribe({onNext: r => count++, onCompleted : () => console.log(count,new Date()-start,"ms")});
> 1000000 912 ms
close session & driver
session.close();
driver.close();
Ok, now we should know how to query Neo4j.
Code on webpage
Within the browser our code will mostly look like this. All additional code will be setup or configuration of the visualization framework.
If you connect to your live database from a webpage, make sure to set up a read-only account. Alternatively you can ask the user for login and password in a form. Upcoming versions of Neo4j will add possibilities of more restrictions on data.
<script src="https://unpkg.com/neo4j-driver"></script>
<script>
  // create driver & session
  const driver = neo4j.driver("bolt://localhost",
                   neo4j.auth.basic("user", "password"));
  const session = driver.session({database:"neo4j"});
  const start = new Date()
  // run query
  session
    .run('MATCH (n)-->(m) RETURN id(n) as source, id(m) as target LIMIT $limit', {limit: neo4j.int(200)})
    .then(function (result) {
      // turn records into list of link-objects (can have different shapes depending on framework)
      // note that we turn the node-ids into javascript ints
      const links = result.records.map(r =>
          { return {source:r.get('source').toNumber(),
                    target:r.get('target').toNumber()}});
      // close session as soon as we have the data
      session.close();
      // log results & timing
      console.log(links.length+" links loaded in "
                  +(new Date()-start)+" ms.")
      // gather node-ids from both sides
      const ids = new Set();
      links.forEach(l => {ids.add(l.source);ids.add(l.target);});
      // create node-array
      const nodes = Array.from(ids).map(id => {return {id:id}})
      // create "graph" representation
      const graphData = { nodes: nodes, links: links};
      // pass graph data to visualization framework
      // (here 3d-force-graph)
      const elem = document.getElementById('3d-graph');
      ForceGraph3D()(elem).graphData(graphData);
    })
    .catch(function (error) {
      console.log(error);
    });
</script>
JavaScript graph visualization frameworks
Most graph visualization frameworks have some kind of “graph” API to take a number of nodes and a number of links or relationships and then render them either with SVG, Canvas or WebGL. Some of them take plain objects as input, others have an API to add nodes and relationships.
Most of the frameworks offer several options for styling, interaction, graph-layout algorithms etc. When we discuss each in turn we will point out the details and where to find more information.
Here are the open-source frameworks we’ll look in this series:
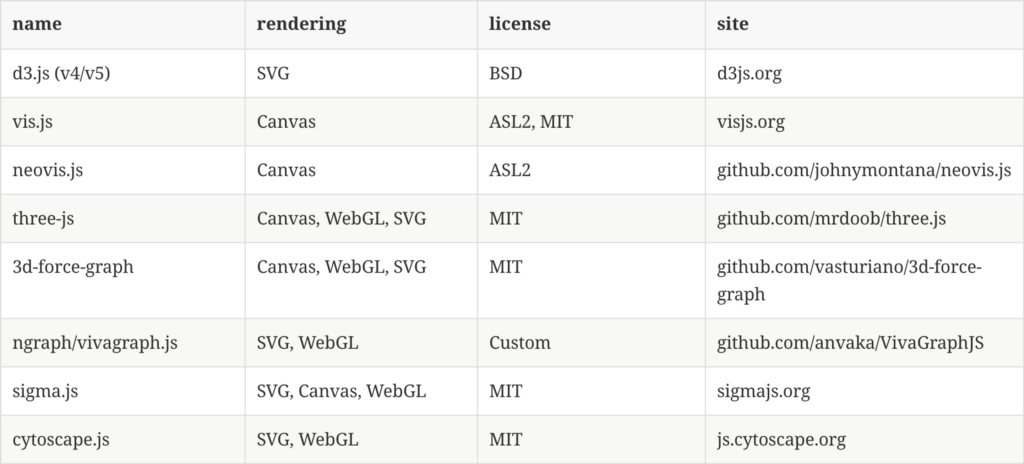
There are a number of other, commercial frameworks and tools, that we also will try to introduce in this series, with the help of each vendor.
- yWorks yFiles
- Linkurio.us OGMA
- Keylines
- Tom Sawyer Perspectives
- Graphistry
- Graphileon
Most of them have Neo4j support built-in.
In the next post next week, William Lyon will introduce neovis.js the Neo4j wrapper he created around vis.js.
If you have questions around graph visualization, make sure to join the Neo4j-Users Discord and ask in the #help-viz channel.
Stay Tuned
Hands on Graph Data Visualization was originally published in Neo4j Developer Blog on Medium, where people are continuing the conversation by highlighting and responding to this story.
Share Article


Explore
Related Articles

A workbench for teams to query, explore, and visualize graph data


SumoDB in Neo4j: Chaining Multiple Graph Algorithms in Snowflake — Part 3