How to have a cybersecurity graph database on your PC

Cybersecurity Professional
5 min read
Let’s talk about GraphKer; a combination of the words Graph and Hacker. You see where it is going. GraphKer is a free and open-source tool, providing a detailed and updated cybersecurity graph database using Neo4j.
Nowadays, when everything is translated into data and is being used for knowledge extraction, every scientist, researcher, industry worker etc., tries to find connectivity between these huge amounts of data. Connectivity and knowledge extraction from data are two highly connected concepts and not just a methodology for scientists. The common use of these concepts has a very important impact on our lives even though we don’t notice it.
In cybersecurity we also have this need. We work in a constantly changing environment and must be ahead of unwanted surprises as much as possible. Every try for a successful analysis of this vast amount of data that we deal with, every day, contributes to cyber defense and protection of our colleagues, clients, data, and organizations. In 2021 we have plenty of great software, hardware, and techniques to enrich our cyber defense. However, we can admit that is not enough, it’s not even close to stop the advanced threats unleashed by malicious users.
We need to educate our colleagues and clients (and users in general) into cybersecurity policies and procedures, and possible ways that a dangerous user could exploit to break in our data or organization. That’s an ongoing process. As long as we stay up to date into cybersecurity techniques, procedures, policies, regulations etc. we can maintain a -relatively- safe environment both virtual and physical. Even this, is not enough. How can we think out of the box? How can we search connections between cyber security incidents, threat actors, hardware, software, skills required, attack paths, etc. to update our cybersecurity level, and operational readiness?
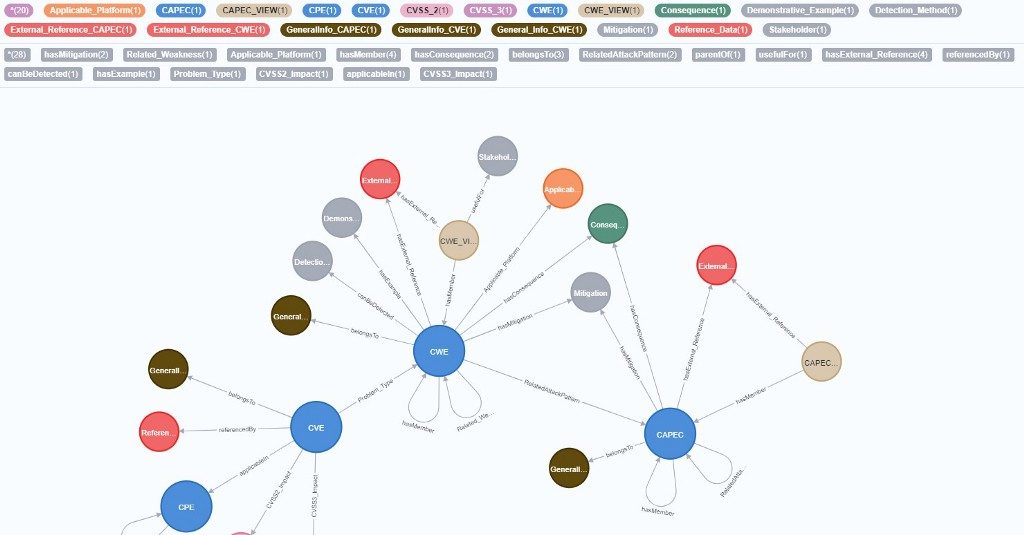
With Neo4j and GraphKer Tool, we demonstrate an example on how we can manage big cybersecurity data, and more specifically every public record of CVE, CWE, CAPEC and CPE provided by MITRE and NIST to find new connections between them and their attributes, and extract knowledge from connected graphs.
GraphKer uses a new ontology approach for data feeds, to reinforce the knowledge extraction ways that graph databases provide. Using Neo4j, we can search these graphs, in a fast and super user-friendly way, and discuss them with users that don’t have any idea about cybersecurity and graph databases. GraphKer makes good use of Neo4j as a native graph database platform and APOC Library Procedures to maintain an efficient way on data storage and retrieval.
To run GraphKer you need to do 3 + 1 things.
- Download and install Neo4j.
- Create and configure the database.
- Install Python requirements for GraphKer.
- Install and use applications created for Neo4j such as Neo4j Bloom, Graphlytic, Neo4j Database Analyzer etc.
Then go to your Linux or Windows terminal and run GraphKer! Depends on your hardware you will have the most recent data feeds of CVEs, CWEs, CAPECs, CPEs in about 6 to 15 minutes.
Run GraphKer on Windows — YouTube
Now you are ready to explore your data in Neo4j graphs!
Check out a DBMS Dump File with 2021 CVEs and relevant CPEs, and all CWEs and CAPECs: amberzovitis/GraphKer-DBMS-Dump (github.com)
GraphKer Repository: amberzovitis/GraphKer: Open Source Tool — Cybersecurity Graph Database in Neo4j (github.com)
GraphKer — Examples on Neo4j Browser — YouTube
Let’s go deep into the data.
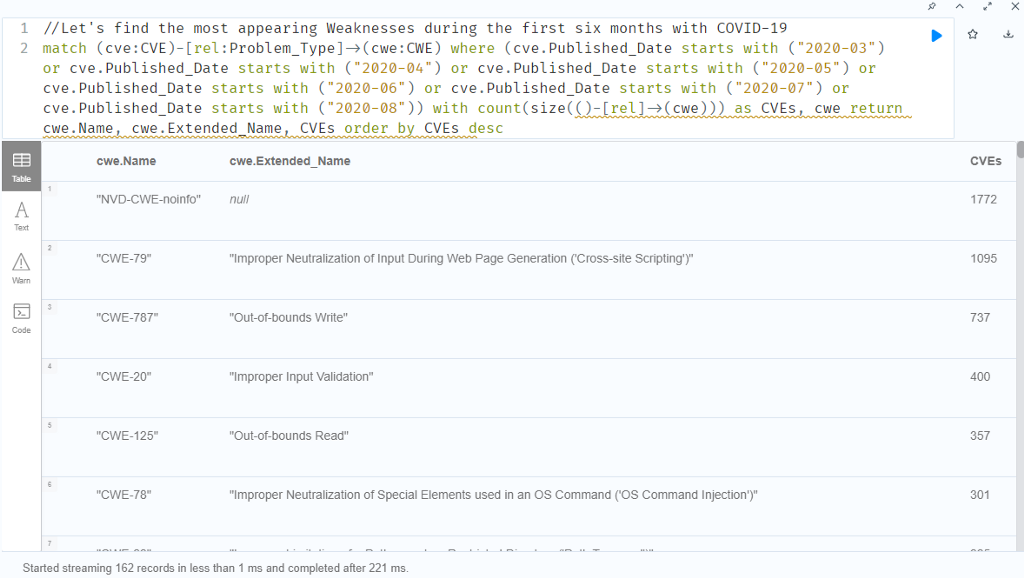
As you can see, there are 1772 vulnerabilities not related to any known weakness yet. In every record in our data, there will be several modifications by the numbering authorities. When we re-run GraphKer for example after 1 month, these number will probably be different even though, these CVEs have been published in 2020. That’s why we need to have the most recent update of our data!
Let’s find out more about CWE-79, Improper Neutralization of Input During Web Page Generation (‘Cross-site Scripting’) with Neo4j Bloom’s help.
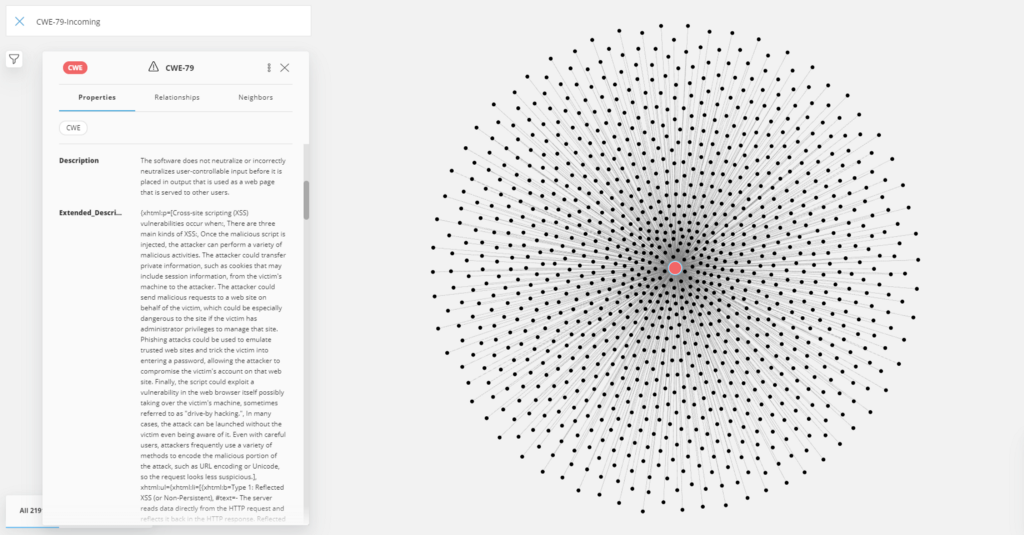
Let’s go deeper into our data. We increase the amount of nodes that Neo4j Bloom can print to our screen and use the maximum of our RAM.
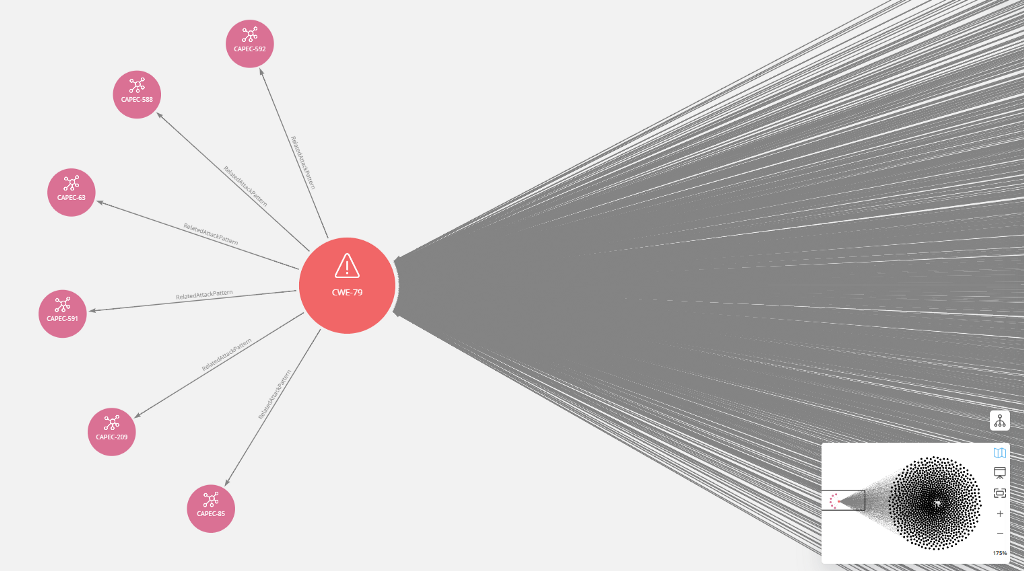
There are six attack patterns that an attacker can use to exploit CWE-79 (Cross-Site Scripting). The interesting part is that 5 of them (CAPEC-85, CAPEC-591, CAPEC-63, CAPEC-588 and CAPEC-592) need Low and Medium skills to be accomplished.
With the expansion of the graph we can get even more data and extract more knowledge. With the above graph — data exploration, we can explain (from a specific point of view) the trends in hacking during the ages of COVID-19. For example, many businesses, during lockdowns all over the world, tried to create e-shops and several web-applications. These web-apps were created so quickly and security issues were ignored. That’s a simple explanation we can give. However, it’s an abstract explanation.
The deeper we dive into our data, the most accurate explanations we can give. That’s the way of using data. That’s the way of using GraphKer.
Don’t forget to think out of the box. The attackers will certainly do it.
For any questions feel free to send me a message on LinkedIn.
I implemented GraphKer during my diploma research of the MSc Distributed Systems, Security and Emerging Information Technologies in University Of Piraeus. A huge thank you to the team of Cyber Security Research Lab | University Of Piraeus.

How to Have a Cybersecurity Graph Database on Your PC was originally published in Neo4j Developer Blog on Medium, where people are continuing the conversation by highlighting and responding to this story.
Share Article


Explore
Related Articles


SumoDB in Neo4j: Chaining Multiple Graph Algorithms in Snowflake — Part 3